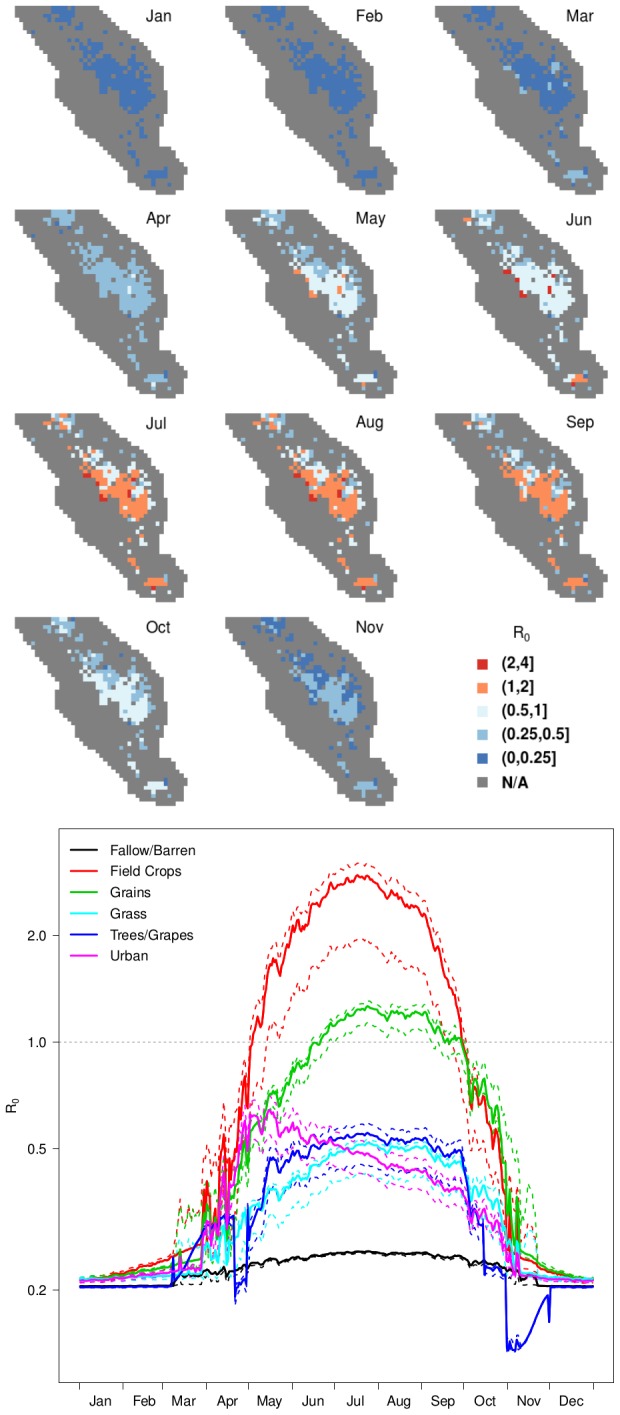
Figure 5. Spatio-temporal patterns in the basic reproductive ratio,  .
.

Maps (upper panel) showing the mean basic reproductive ratio,  , by month, and a graph of median daily
  values (lower panel) by land use class. Dashed lines in the lower panel indicate the
  and
and  percentiles for the land use class of the same color. Wetlands and other grid cells without competent hosts (i.e., dairy cows) are mapped in gray and were not included in the analysis because transmission would not be expected in those locations. December is omitted from the maps because it did not differ meaningfully from January, with
  universally
  1.
1.
