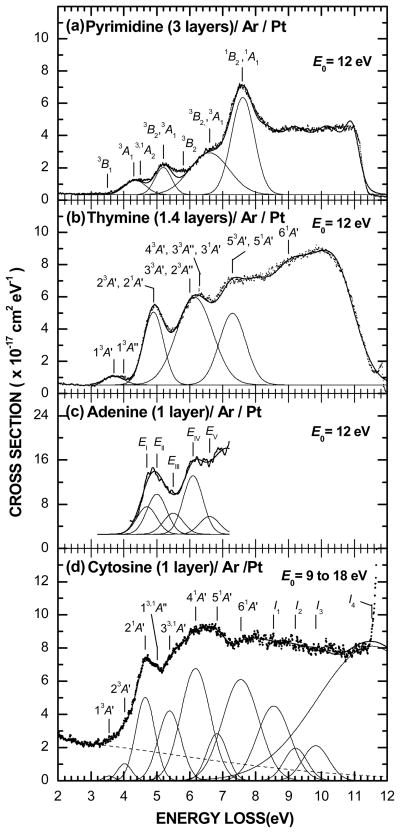
Figure 1.
(a) Electronic EEL spectrum at the incident electron energy E0 = 12 eV of 3 layers of pyrimidine deposited on a 6-layer spacer of Ar condensed on the Pt substrate. (b) Electronic EEL spectra at E0 = 12 eV of 1.4 layers of thymine deposited on a 6-layer spacer of Ar. (c) Electronic EEL spectrum at E0 = 12 eV of a monolayer of adenine deposited on a 6-layer spacer of Ar. (d) Survey electronic EEL spectrum of monolayer of cytosine deposited on a 3-layer spacer of Ar. The thin solid line passing through each of the spectra results from curve fitting with multiple Gaussian functions delimiting the different electronic excitation regions, as shown in the bottom of each panel. The dashed line accounts simply for the background contribution arising from multiple energy losses in the Ar/Pt substrate.

