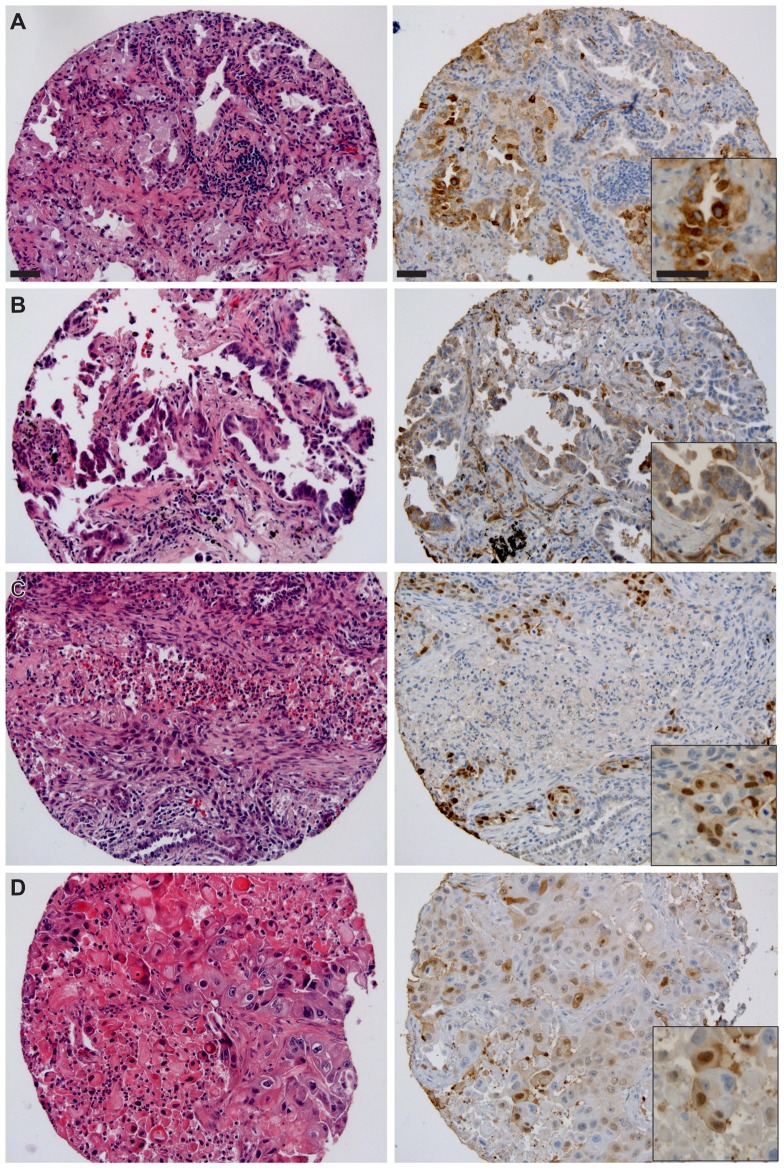
Figure 6. Vascular endothelial cell and tumor cell-derived VEGFR2 immunoreactivity on representative cases on NSCLC cohort YTMA79-3. Left panels, H&E and right panels, corresponding VEGFR2 IHC.
(A) Representative ADC patient. Inset highlights range of cytoplasmic immunoreactivity. (B) ADC, second representative patient. Inset, note endothelial cell immunoreactivity in proximity to membranous tumor cell immunoreactivity. (C, D) Two representative SCC patients. Slides were counterstained with hematoxylin. Original magnification was ×200 for large images and ×400 for insets. Scale bars in A: 50 µm, applicable to subsequent panels.

