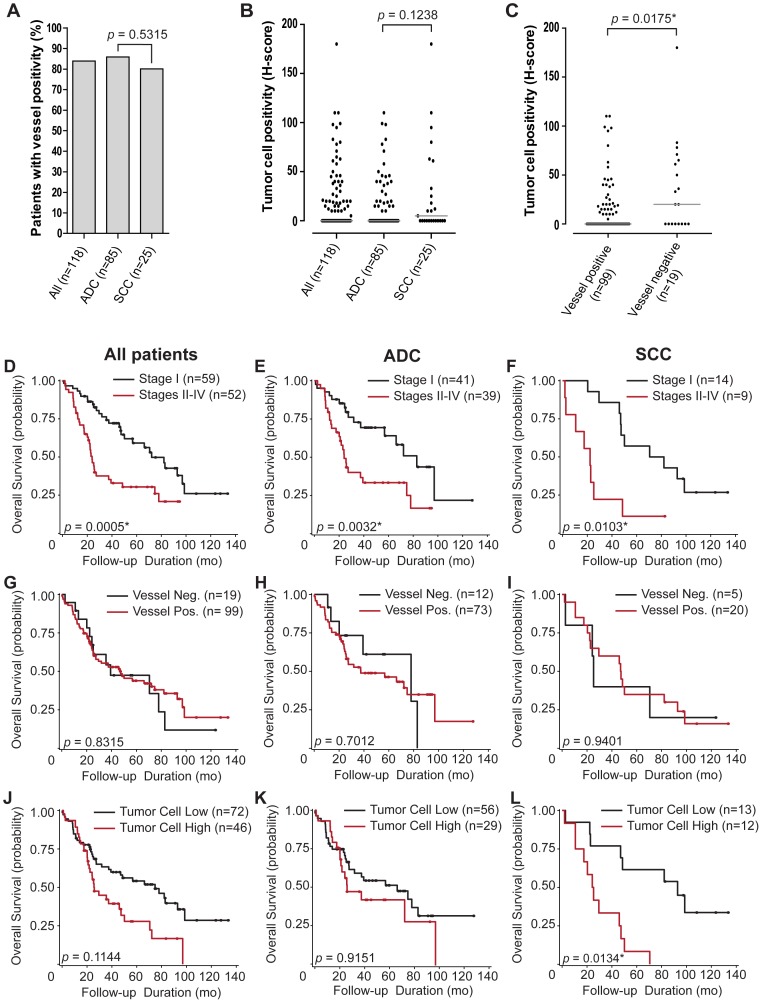
Figure 7. Characterization of VEGFR2 pathological scores in NSCLC patient cohort.
(A) percent of patients with VEGFR2 vessel positivity per histological subtype. (B) VEGFR2 tumor cell positivity per histological subtype. (C) VEGFR2 tumor cell positivity per vessel immunoreactivity status. Light grey lines show median values for each group. p-values for associations are shown with statistically significant observations indicated with an asterisk. Kaplan-Meier survival curves were grouped by disease stage I or stages II–IV for: whole patient population (D), ADC (E), and SCC (F). Survival curves were also grouped by vascular endothelial cell expression of VEGFR2 for: whole patient population (G), ADC (H), and SCC (I). Additional survival curves were grouped by tumor cell-derived VEGFR2 immunoreactivity for: whole patient population (J), ADC (K), and SCC (L). Statistically optimal VEGFR2 expression cutpoints for dividing patients into groups based on survival were identified as H-scores of 10, 0, and 10, respectively. p-values for each curve are shown with statistically significant observations indicated with an asterisk. Points on the curves represent censored data (patients alive at follow-up time). For analysis involving VEGFR2 expression, only tumor-cell derived VEGFR2 immunopositivity in SCC patients showed a statistically significant associate (p = 0.0134) in median overall survival between VEGFR2 high (24.7 mo) and VEGFR2 low populations (92.8 mo).

