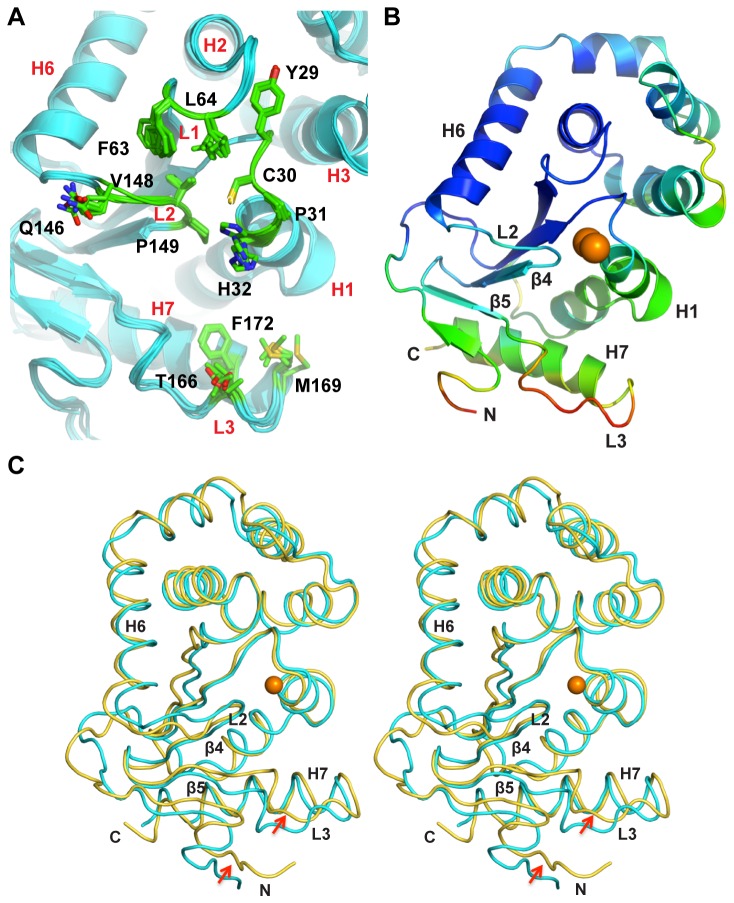
Figure 5. Conformational variability in X-ray and NMR structures of KpDsbA.
A Superimposition of the six KpDsbA molecules (blue) in the asymmetric unit shows the limited conformational variability in the side chains of active site and L1, L2, and L3 loop residues (stick representation). B. Cartoon representation of the KpDsbA crystal structure (Molecule D), with Cα atoms colored by temperature factor (B-factor). Molecule D was selected as its temperature factor distribution is the most pronounced due to minimal crystallographic contacts. In particular, the high B-factor of loop L3 indicates mobility in that region, consistent with the NMR data C. Stereo diagram of representative states of reduced (X-ray, cyan) and oxidized (NMR, yellow) structures of KpDsbA. Red arrows highlight differences in the structures at N-terminal and L3 loop regions.

