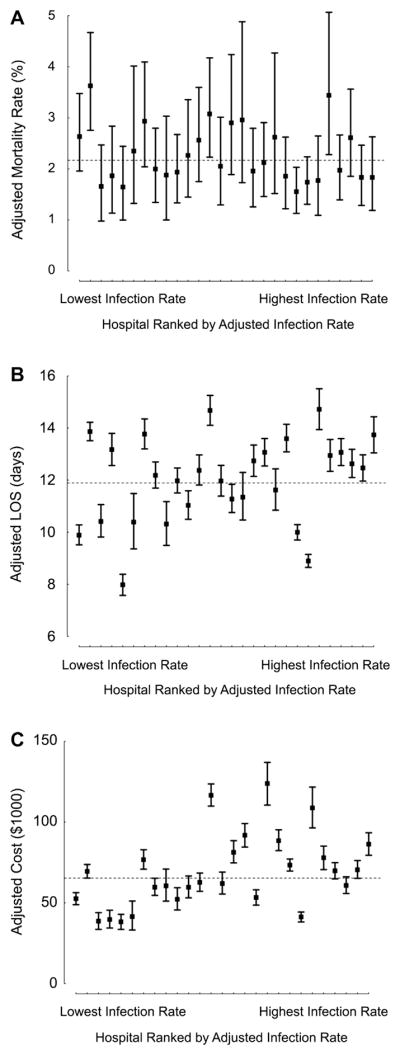
Fig 2.

Adjusted outcomes across hospitals ranked by infection rate. (A) Mortality; (B) postoperative LOS; (C) total hospital costs. See Table 2 for corresponding numeric data regarding adjusted outcomes across hospital infection groups. Of note, in the hospital-level analyses, patients who died within 7 days of surgery were excluded as described in Materials and Methods. (Boxes = adjusted estimates for each hospital; lines = 95% Bayesian probability intervals; dashed line = mean value in overall cohort; LOS = length of stay.)
