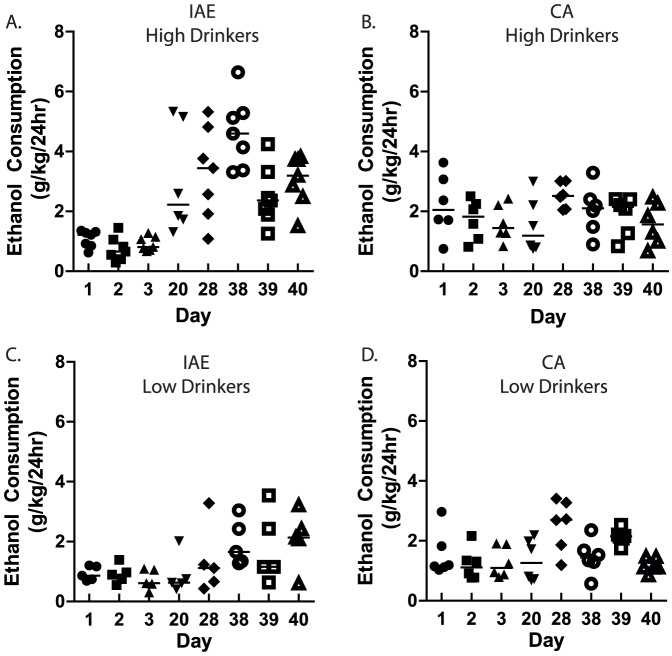
Figure 2. Individual ethanol intake values in F344 rats using the intermittent access (IAE) and the continuous access (CA) procedures.
Animals were divided into groups of high-drinkers (A-B) and low drinkers (C-D) and ethanol intake values plotted for the IAE procedure (A, C) and the CA access procedure (B, D) for sessions on Days 1, 2, 3, 20, 28, 38, 39, 40. The values are expressed as mean ethanol intake (g ( kg ( 24 h) at each drinking session.

