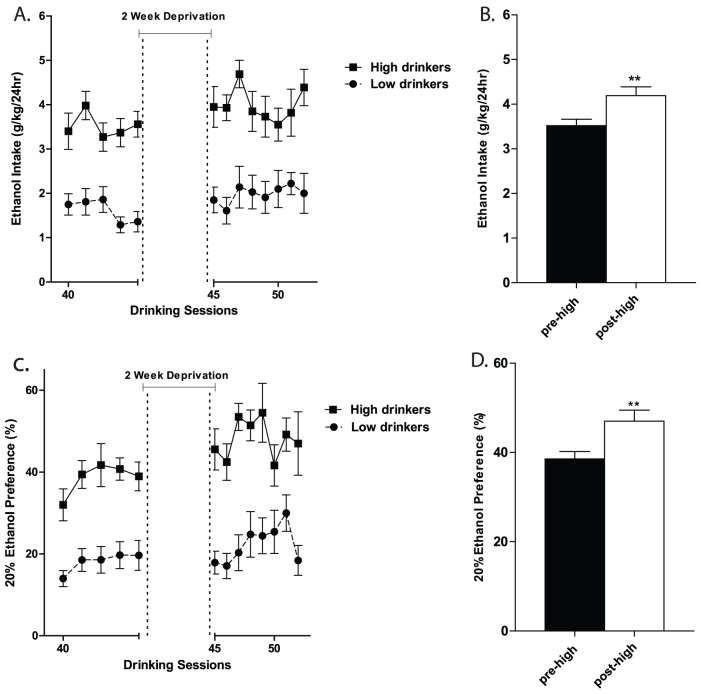
Figure 3. Ethanol consumption and preference following a two week deprivation period.
(A) 20% ethanol consumption in F344 rats trained using the IAE procedure before and after a two-week deprivation period. (B) Animals in the high group exhibited a significant escalation in ethanol intake following a two week deprivation period. (C) Ethanol preference before and after a two-week deprivation period. (D) Animals in the high group exhibited a significant increase in ethanol preference following deprivation. The values are expressed as mean ethanol intake (g/kg/24h) or preference (ratio of ethanol over total fluid intake) ± SEM. To calculate the ADE effect the five drinking sessions preceding and three drinking sessions following deprivation were analyzed by one-way ANOVA, **, p<0.01 comparing pre- and post-deprivation periods.

