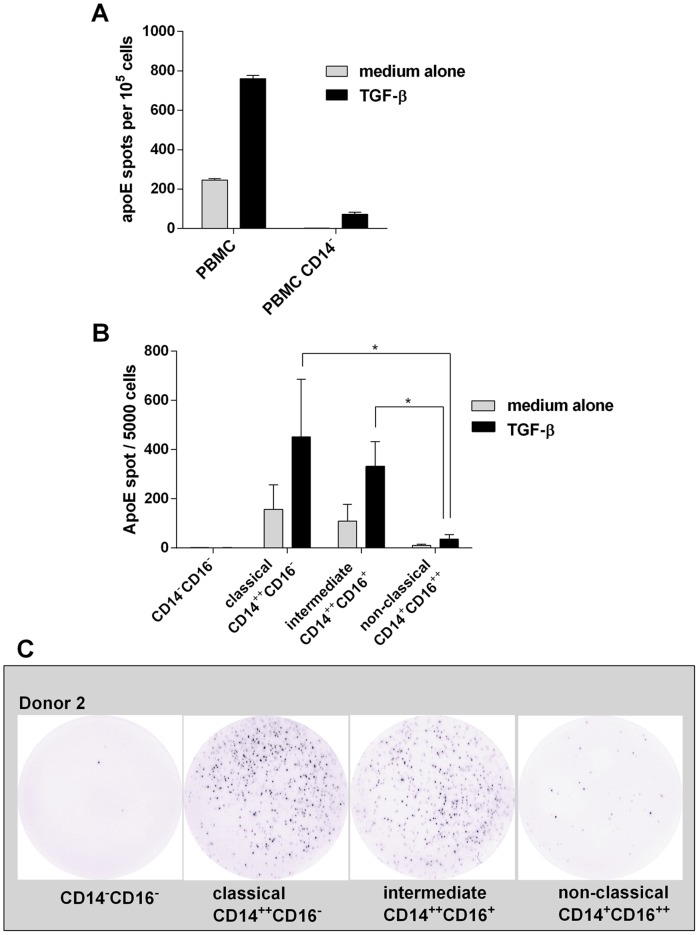
Figure 1. ELISpot analysis of ApoE secretion in response to TGF-β -treatment.
A) Whole PBMC were incubated overnight in the presence (black bars) or absence (grey bars) of TGF-β (10 ng/ml) and the number of apoE-secreting cells was determined by ELISpot. Comparison was made with PBMC depleted of CD14+ cells. Results shown are from one representative donor (means ± SD of quadruplicates). Similar results were obtained in three separate experiments with three different donors. B) PBMC from three donors were sorted into different monocyte subpopulations and non-monocytic cells by a fluorescence-activated cells sorter and tested in ELISpot for apoE production using 5×10³ cells/well. Values represent means ± SD of three donors. * p<0.05. Individual data are shown in supplementary figure 1. C) Representative examples of apoE spots (5×10³ cells/well) produced by non-monocytic cells, classical monocytes, intermediate monocytes and non-classical monocytes in response to TGF-β.

