
Figure 6. ELISpot and ELISA analysis of apoE secretion by cultured macrophages.
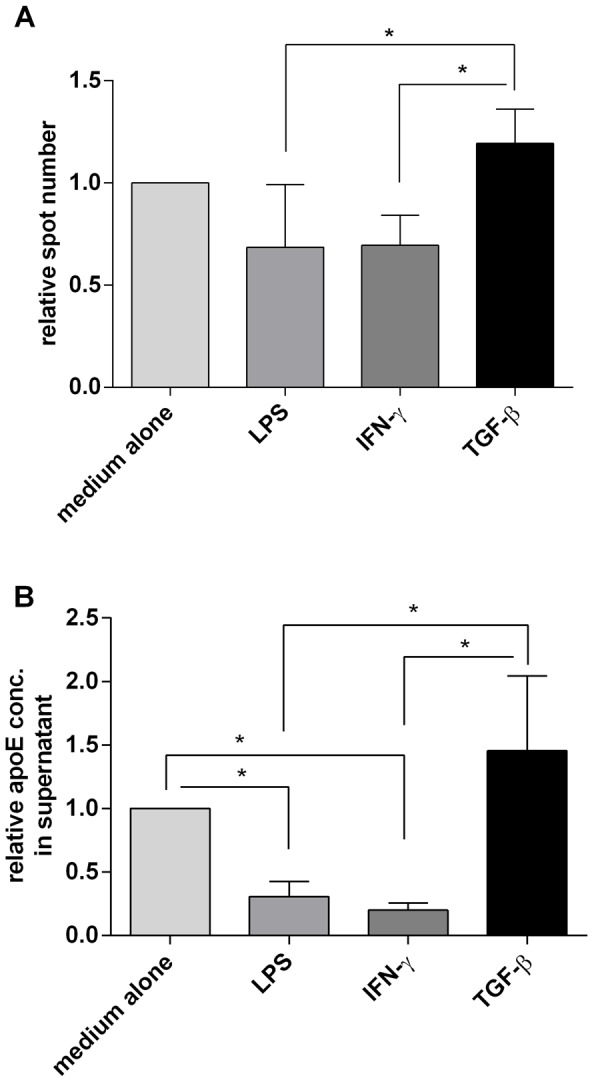
A) ApoE secreting cells were measured by ELISpot using monocyte-derived macrophages (800 cells/well) incubated for 18 hours in medium alone or in the presence of LPS (1 ng/ml), IFN-γ (10 ng/ml) or TGF-β (10 ng/ml). Results are shown as relative spot numbers where spots in wells with only medium is set to 1. B) ELISA analysis of ApoE content in culture supernatants of monocyte-derived macrophages (7000 cells/well) incubated for 48 hours with the same substances as in A. As above, results are given as relative ELISA values where the concentration of ApoE in wells with only medium were set to 1. Figures represent means ± SD of four donors, * p<0.05.