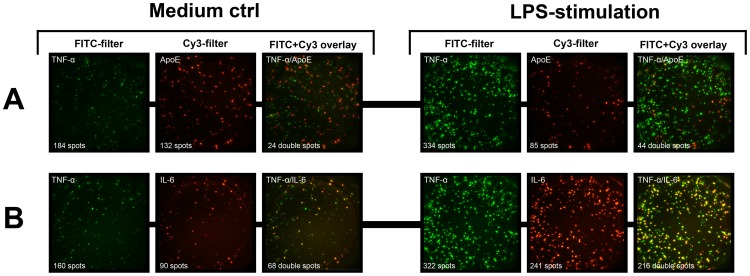
Figure 7. Fluorospot analysis of apoE, TNF-α and IL-6 secretion by macrophages.
Monocyte-derived macrophages (800 cells/well) were incubated 20 hours in the presence or absence of LPS (100 ng/ml) and cells secreting apoE, TNF-α and IL-6 were determined in the FluoroSpot assay. The figure shows examples of Fluorospot wells with the simultaneous detection of apoE (red spots) and TNF-α (green spots) (A), as well as IL-6 (red spots) in combination with TNF-α (green spots) (B). The numbers of double producing cells were determined as spots having the same centre point in an image overlay of FITC and Cy3 images. Similar results were obtained using four different donors. More data are shown in Table S1.

