
Graphical comparison of the PID in MERS-CoV and other coronaviruses.
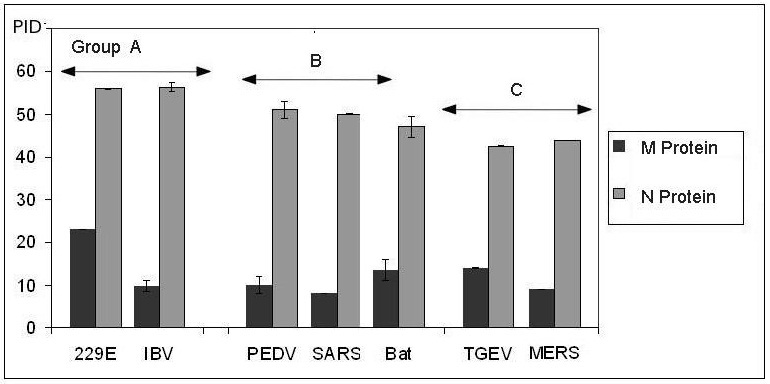
The chart illustrates the pair-wise similarity of disorder contents in M- and N-proteins of MERS-CoV and TGEV belonging to the category C. M- and N-proteins of SARS-CoV and PEDV (both are from the category B) also possess similar PID contents, whereas the proteins of the bat coronavirus are located at the borderline between the categories B and C. Group A (HCoV 229E and IBV) is characterized by the most disordered M- and N-proteins.