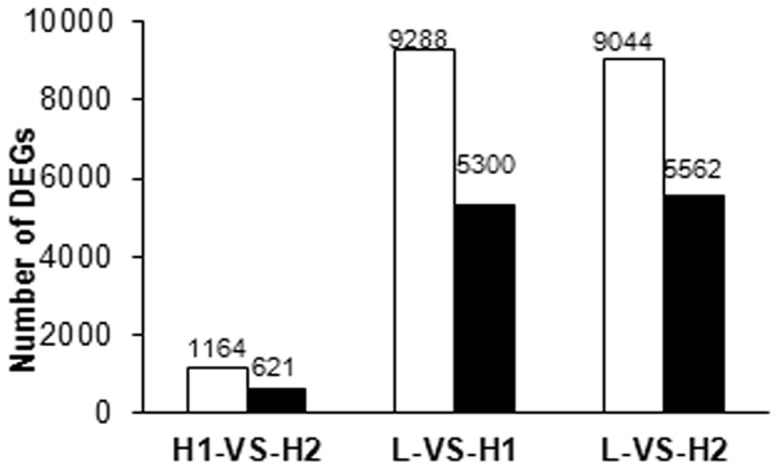
Figure 3. Changes in the gene expression profile among the different floral inductions.

The gene expression profiles were determined by RNA-Seq. The changes in the number of up-regulated and down-regulated genes between H1 and H2; L and H1; and L and H2 are summarized. The white box represents the up-regulated genes and the black box represents the down-regulated genes.
