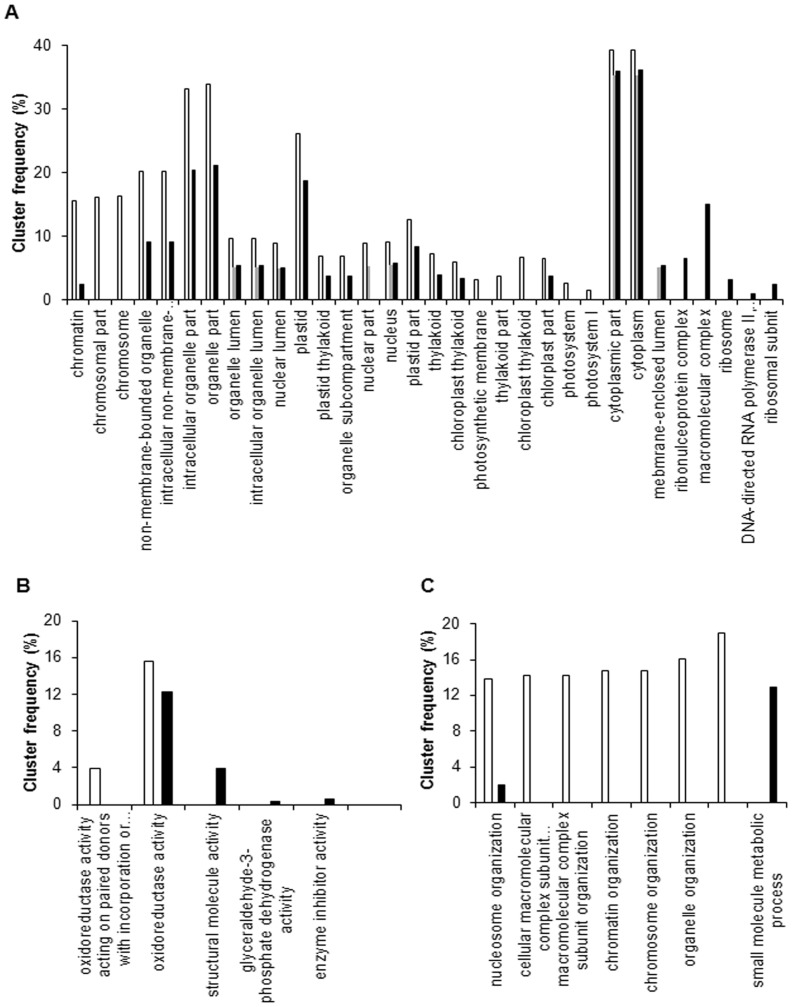
Figure 4. Functional enrichment analyses of DEGs in the GO annotation.
The cluster frequency of the GO terms that were significantly enriched (P-value < 0.05) were analyzed in the three comparisons (H1-VS-H2, L-VS-H1, and L-VS-H2). The white box represents H1-VS-H2, the gray box represents L-VS-H1, and the black box represents L-VS-H2. A: cellular component; B: molecular function; C: biological process.

