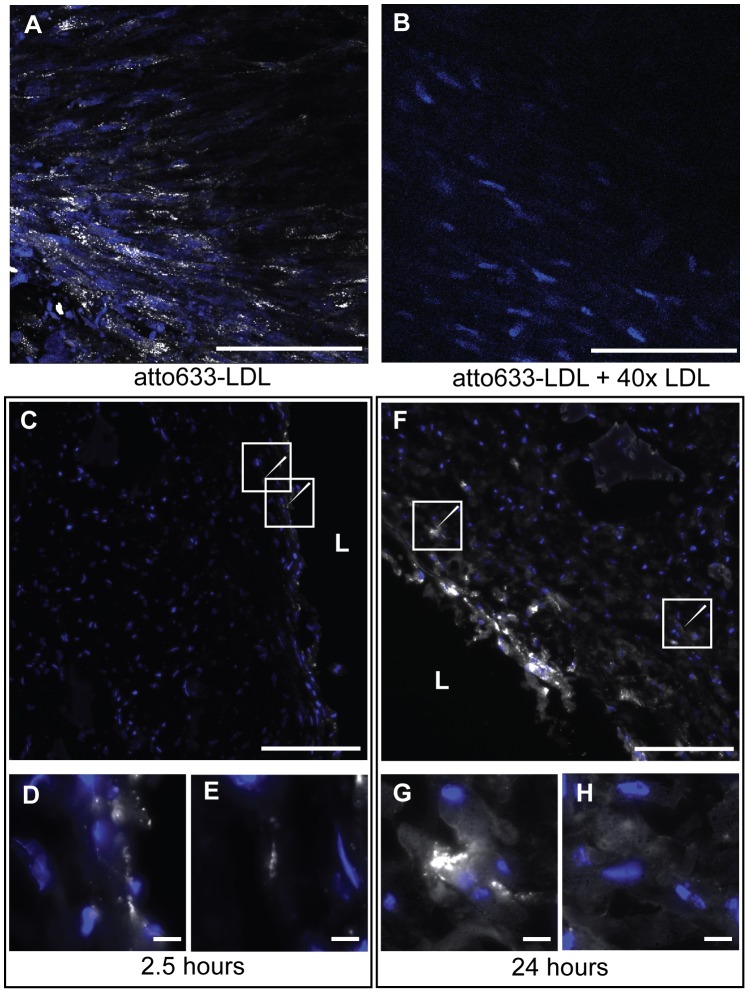
Figure 5. Insudation of LDL into the engineered artery.
The insudation of LDL into the tissue (blue: nuclei) was analysed by confocal microscopy after incubation with 20 µg/ml of fluorescent LDL (white) for 24 hours and demonstrated the vesicular localization on the upper cell layer (A). The specificity of the signal was assessed by competition with 40-fold excess of non-labelled LDL (B). LDL localization in the tissue was further analysed by microscopy of tissue cryosections and demonstrated the time-dependent uptake and the sub-endothelial localization of the LDL (C: 2.5 hours and F: 24 hours). Zoom in of interesting regions shown with the arrows are presented in D and E for 2.5 hours and F and G for 24 hours. Bars represent 200 µm (A-C,F) and 20 µm (D-E, G-H) and L: Lumen.

