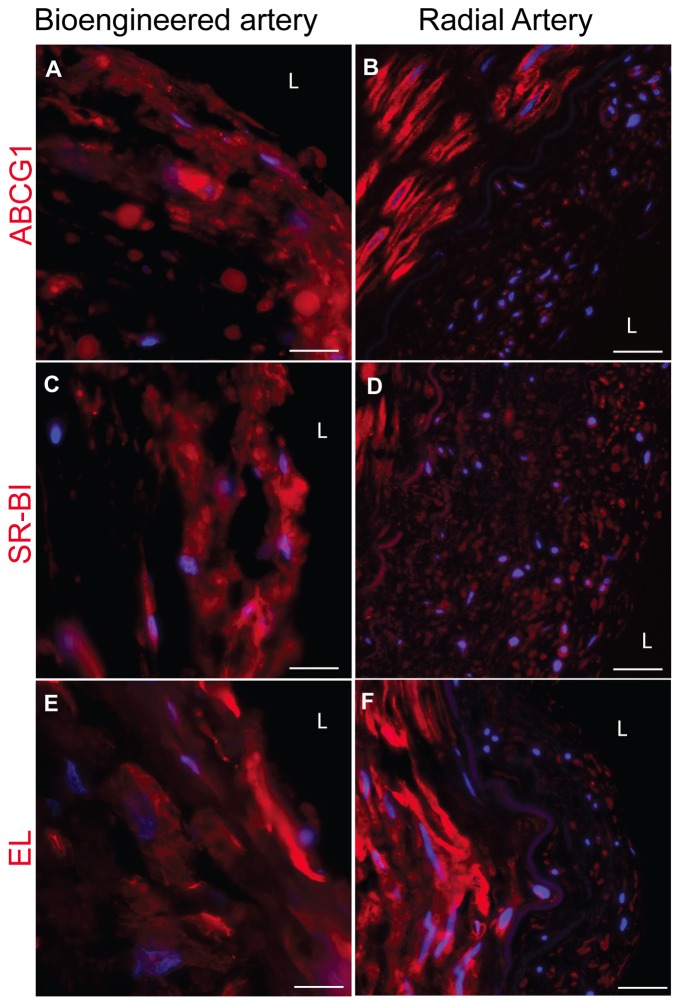
Figure 7. Expression of ABCG1, SR-BI and EL in the bioengineered artery in comparison to native artery.
The expression of ABCG1 (red) (A), SR-BI (red) (C) and EL (red) (E) was assessed by immunofluorescence staining after cryosection of the engineered artery and compared to a native radial artery (B, D, F) (blue: nuclei). Bars represent 50 µm.

