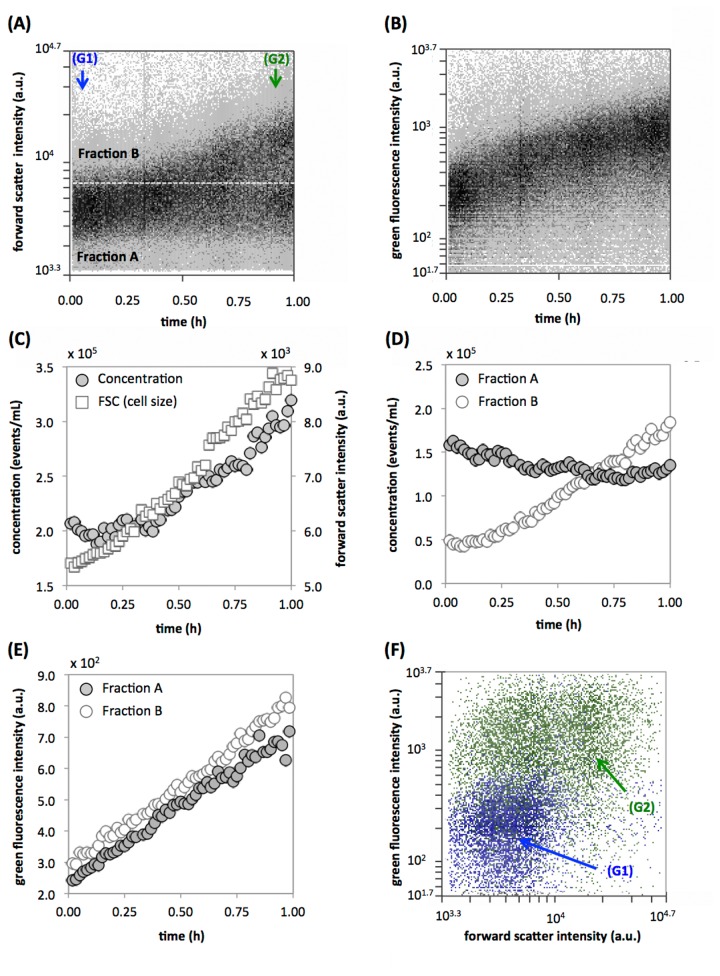
Figure 3. Initial growth response of late stationary phase E. coli cells inoculated into fresh growth medium.
(A) Raw RT-FCM data of FSC intensity over time, with marked regions (G1) and (G2) showing data used for panels F. A set FSC value (white dotted line, indicating the line below which 80 % of particles lie at the beginning of the measurement) separates a fraction of small (Fraction A) and large (Fraction B) cells which are used for calculations in panels D and E. (B) Raw data of bacterial GFP fluorescence (ex. 488 nm/em. 530 nm) resulting from the enzymatic cleavage of CFDA. (C) Processed data (1-minute intervals) showing the changes in total cell concentration as well as median cell size (measured with forward scatter). (D) Changes in the cell concentrations of small (Fraction A) and large (Fraction B) cells (from panel A). (E) Changes in the green fluorescence intensity of small (Fraction A) and large (Fraction B) cells (from panel A). (F) FCM overlay density plot of the culture at the start (blue data; (G1)) and end (green data; (G2)) of the experiment.

