
Figure 10. Accumulation of lipid droplets in hepatic cells in 16-month old LRRK2 KO rats vs. WT.
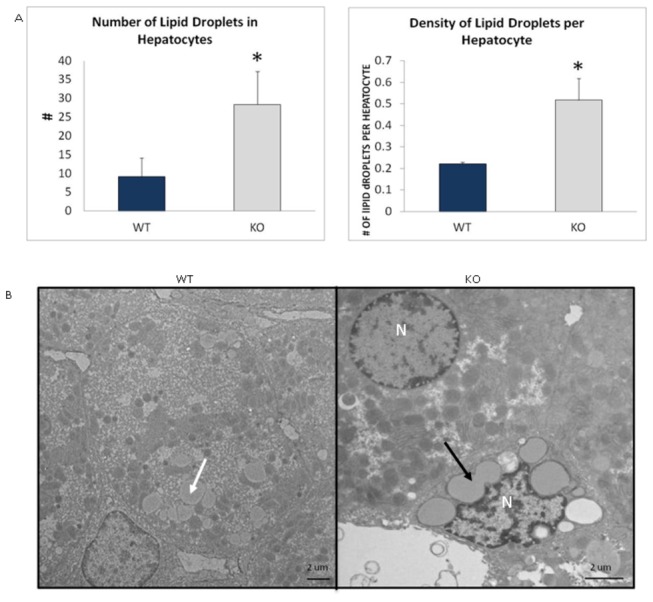
(A) Graphs showing changes in number of lipid droplets and density of lipid droplets per hepatocyte. (WT n=2, KO n=4) *- denote significance by Student’s t-test, P<0.05. Values are means + Standard Error of the Mean. (B) Comparison of normal accumulation of lipid droplets (white arrow) in hepatic cells in WT to increased accumulation in hepatic cells (black arrow) in KOs. N: Nucleus. Scale bar = 2 µm