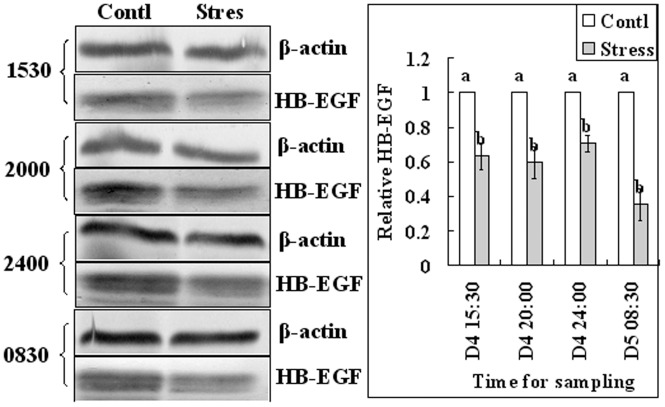
Figure 3. Relative levels of HB-EGF in endometrium of control (Contl) mice and mice stressed with regimen 2 (Stres).
Results of Western blot analysis. Endometrium samples were collected for western analysis at 15:30, 20:00 and 24:00 of day 4 and at 08:30 of day 5. On each experimental day, the value of control mice was set as one and the value of stressed mice was expressed relative to this value. a,b: Means with a different letter above their bars differ significantly (P<0.05).

