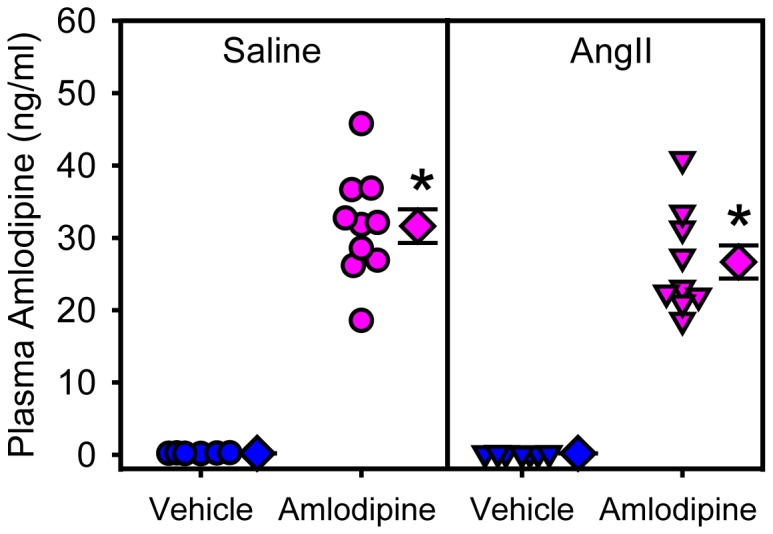
Figure 1. Plasma concentrations of amlodipine.

Plasma concentrations of amlodipine were measured at the end of study. Circles and triangles represent individual mice, diamonds are means of groups, and error bars are SEMs. * denotes P<0.0001 comparing amlodipine groups with saline + vehicle and AngII + vehicle groups by two way ANOVA.
