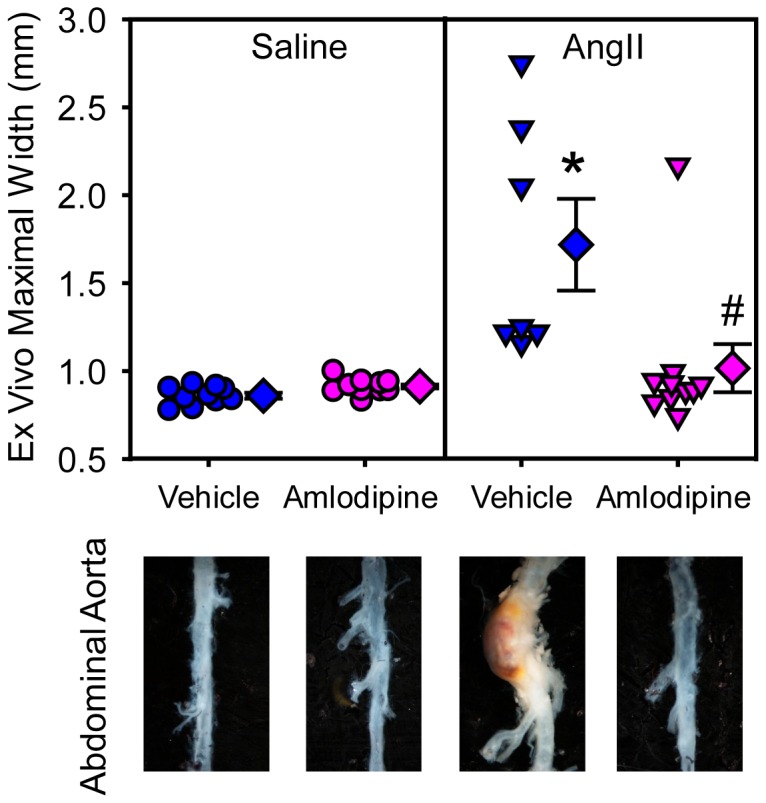
Figure 3. Amlodipine ablated AngII-induced abdominal aortic aneurysms.

Ex vivo suprarenal aortic diameter was measured after termination. Circles and triangles are individual measurements, diamonds means of the groups, and error bars SEMs. Representative images of aortas are shown below the graph. Statistical analyses were performed using nonparametric Kruskal-Wallis test. * denotes P=0.0006 for comparison between AngII + vehicle and saline + vehicle, and # denotes P=0.003 for comparison between AngII + amlodipine and AngII + vehicle groups.
