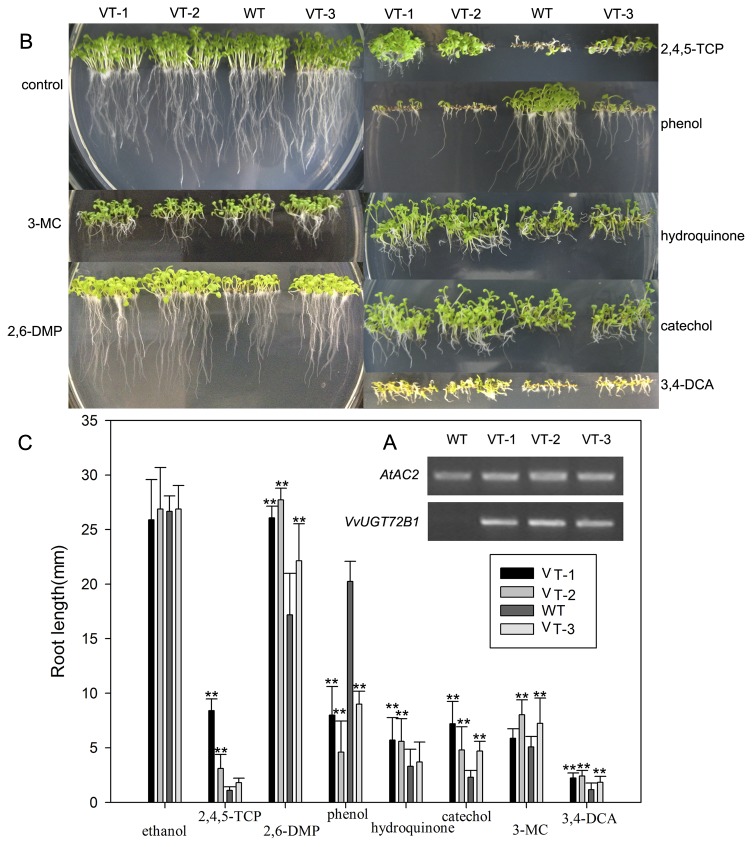
Figure 5. VvUGT72B1 expression in Arabidopsis plants.
(A) RT-PCR-amplified VvUGT72B1 fragments from the plants of WT and VT lines (VT-1, VT-2, and VT-3) with AtAC2 as a reference. (B) Tolerance of Arabidopsis plants on plates. WT and VT plants germinated and grown vertically for 10 days on MS agar plates containing methanol, 2,4,5-TCP, 2,6-DMP, phenol, hydroquinone, catechol, 3-MC, or 3,4-DCA. (C) Root length of plants grown on MS agar plates containing PCs or 3,4-DCA. The data are presented as mean ±SD (n = 30). Statistical analyses of differences in VT lines with respect to WT plants is performed using Dunnett’s two-tailed t-test. Significant difference is denoted with one (P<0.05) or two (P<0.01) asterisks.

