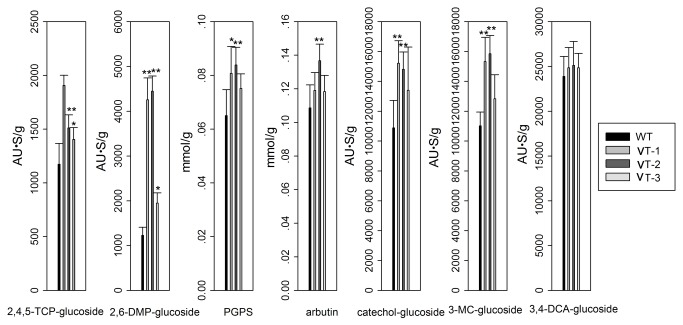
Figure 6. HPLC analyses of plant extracts.
The contents of glucosides of plants were determined after the 2-week-old WT and VT lines were cultured in MS liquid medium containing 2,4,5-TCP, 2,6-DMP, phenol, hydroquinone, catechol 3-MC, or 3,4-DCA for 1 day. Values represent the mean of triplicate incubations with error bars showing SD (n = 3). Statistical analysis of differences in VT lines with respect to WT plants in each treatment is performed using Dunnett’s two-tailed t-test. Significant difference is denoted with one (P <0.05) asterisk.

