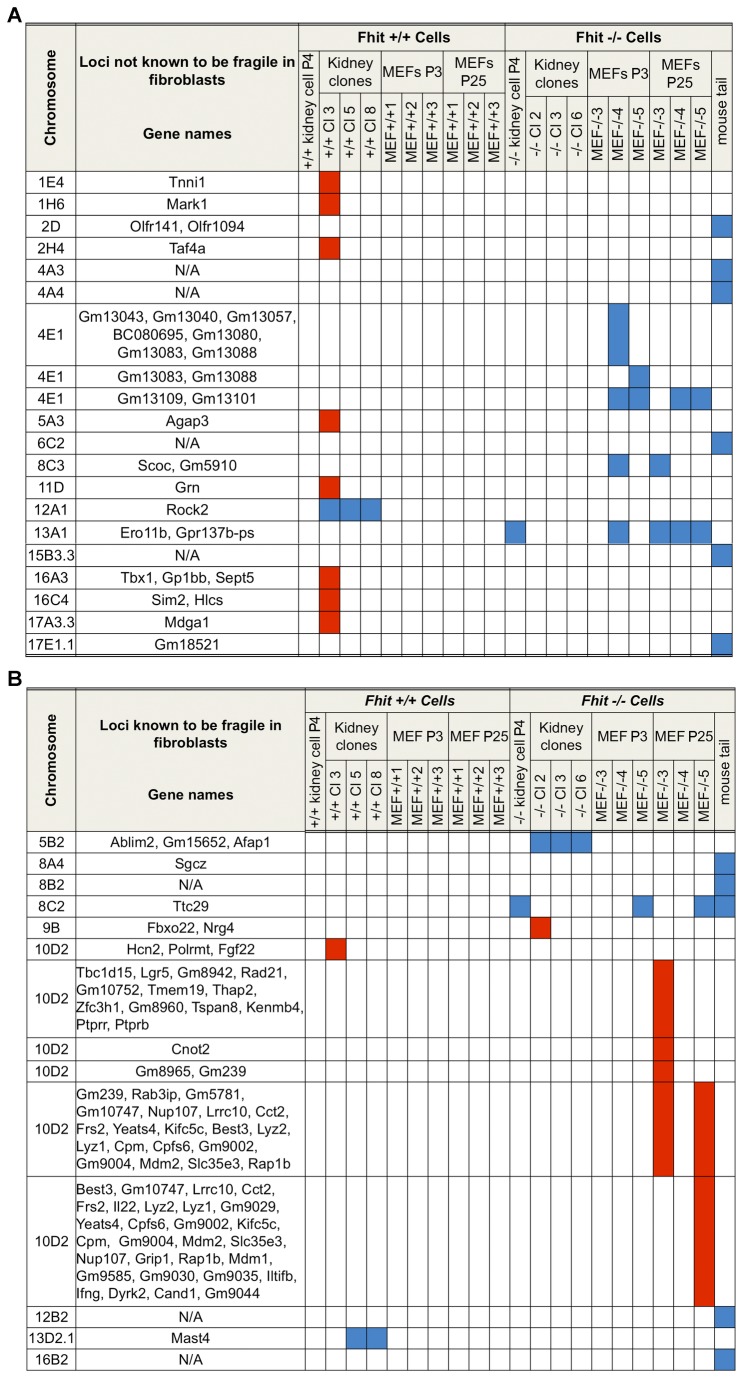
Figure 1. CNVs in MEFs, mouse kidney-derived cells and mouse tissue.
(A) Summary of CNVs detected at chromosome loci not known to be fragile, in mouse kidney-derived cells, kidney-derived cloned cells, and pre- and post-senescence MEF cell lines derived from +/+ and -/- mice, and -/- tail tissue, using the Affymetrix Mouse Diversity Genotype Array; CNV data for MEF cultures was previously reported [14] and is included here for comparison to the kidney culture DNAs. Blue columns indicate allele loss (fold-change range, 0.26 to 0.61), and red columns indicate gain (fold-change range, 1.51 to 1.91). For more detail, see Table S1. (B) CNVs at chromosome fragile loci. CNVs at fragile loci detected in the same mouse cell lines and tissues. Blue columns indicate allele loss (fold-change range, -0.5 to -0.83) and red columns indicate gain at specific fragile chromosome loci (fold-change range, 1.50 to 2.51).

