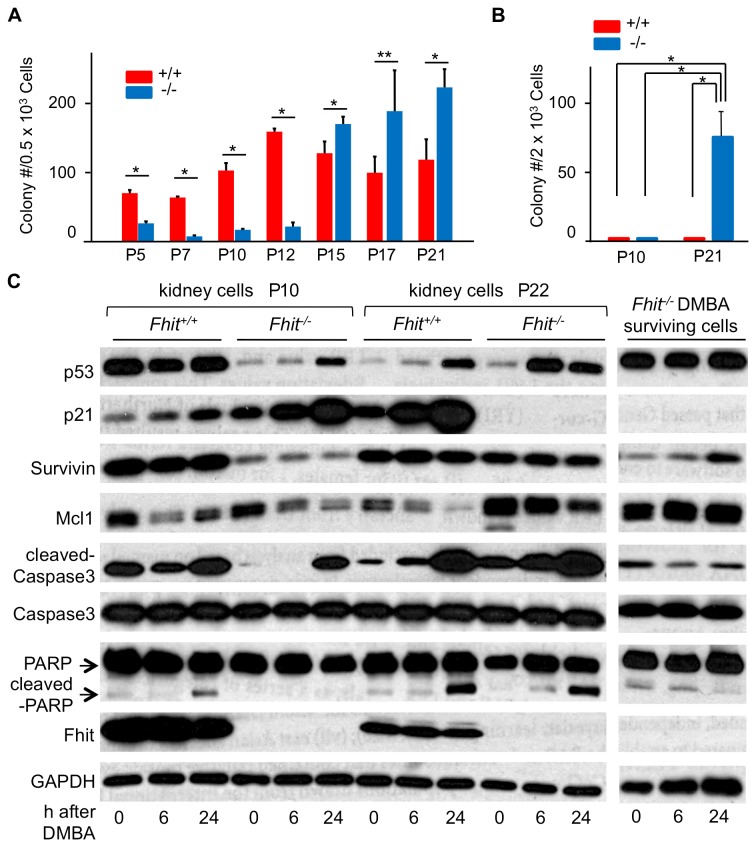
Figure 4. Expression of apoptosis-related proteins in -/- kidney cells with and without exposure to DMBA.
(A) Clonogenicity of +/+ and -/- kidney-derived cells with passage progression. Note the remarkable increase in colony number in -/- cells post P12 while the colony number for +/+ cells shows a steady rise to P12 and then decreases. *P <0.05; **P =0.069. (B) Clonogenicity of +/+ and -/- kidney cells after a 24 h DMBA (20 µM) treatment (at P10 and P21). *P <0.05. (C) Expression of apoptosis-associated proteins in the kidney cells before and 6 and 24 h after DMBA exposure, detected by immunoblot (at P10 and P22) (left panel). Expression of apoptosis-related proteins in -/- DMBA survivors (right panel): Note that cleaved Caspase 3 and cleaved PARP, both apoptosis markers, are markedly decreased in the DMBA-surviving cells whereas they were very similarly activated in the +/+ and -/- cells following initial DMBA exposure. In (A, B) bar graphs represent means and error bars standard deviations from at least 3 independent experiments.

