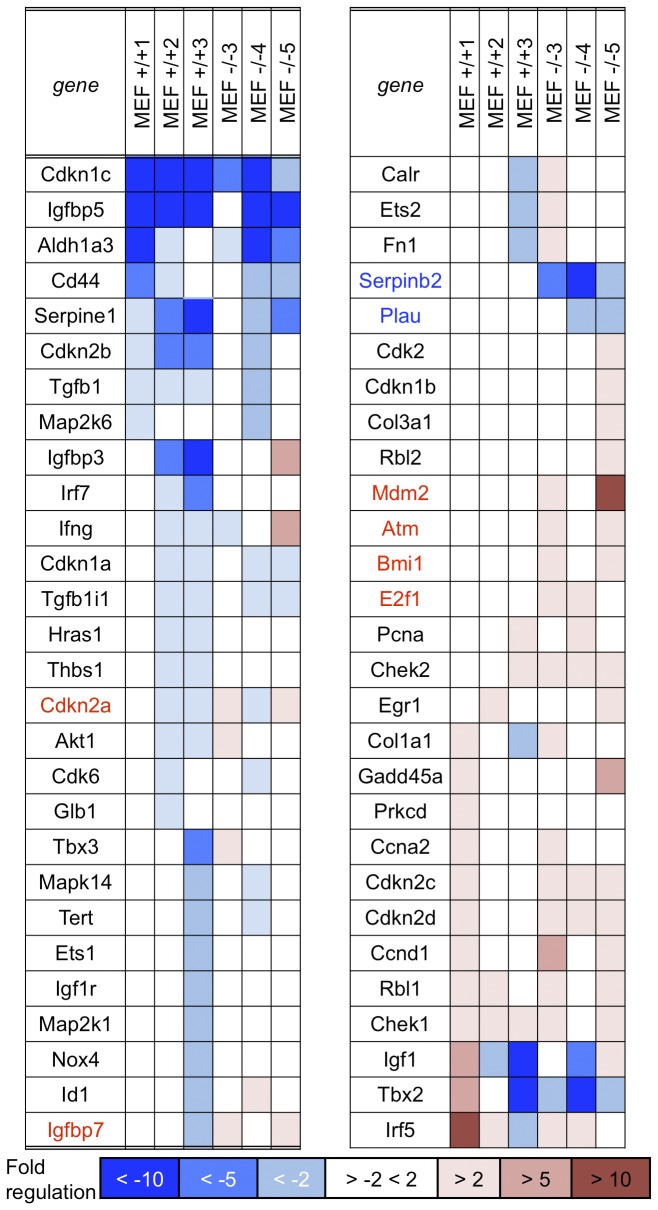
Figure 7. Gene expression changes in MEF cells.
mRNA expression in MEF cells at early and late passages was also examined using the RT² Profiler PCR Array and fold change was calculated. Dark blue in the columns indicates >10-fold decrease of gene expression at late relative to early passage, medium blue indicates >5-fold decrease and light blue indicates >2-fold decrease. White columns indicate less than 2-fold change. Light pink indicates >2-fold increase of gene expression at late passage, medium pink indicates >5-fold increase and red indicates >10-fold increase in expression. Gene names are given in blue or red for those genes that show statistically significant differences in expression in the -/- vs +/+ cells in at least two of the three -/- vs +/+ MEF cell lines. Note the intra- and inter-strain variation in expression changes among the three +/+ and -/- MEF cell lines and the few changes in common with the kidney cell lines (E2f1, up in -/- of both cell types, Ccnd1 up in two of three -/-MEFs as well as -/- kidney); also Atm and Chek2 up in -/- lines, perhaps indicating ongoing DNA damage.

