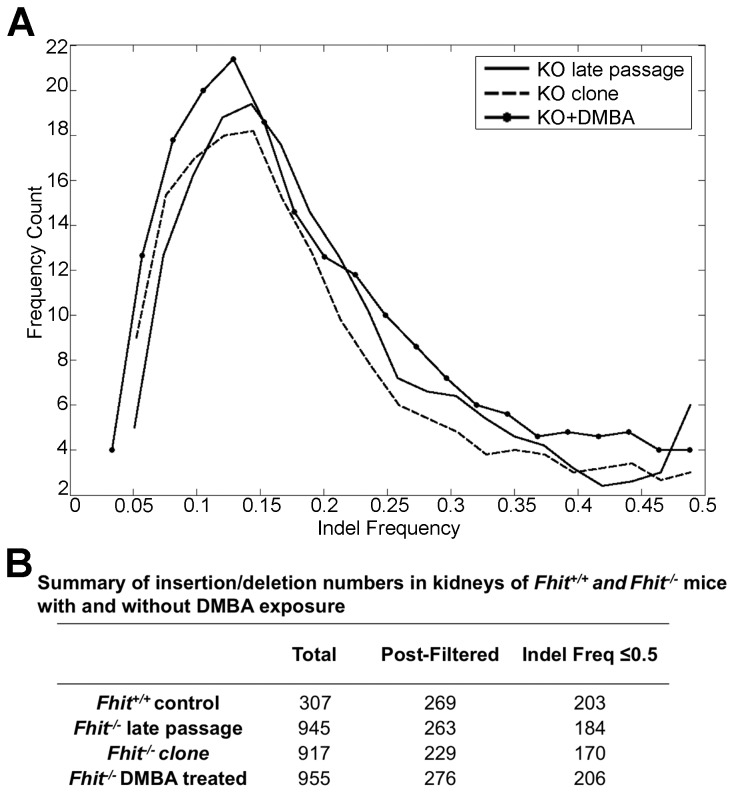
Figure 9. Exome insertions/deletions in mouse kidney cells with and without DMBA exposure.
(A) Histogram of indel frequencies (<0.5) in -/- kidney DNAs from exome sequence data after subtraction of indels common to all of the -/- cells, -/- kidney cells at P22, -/- clone 6 kidney cells (cloned at P17 and grown for 3 more passages after cloning), and -/- kidney cells that survived treatment with DMBA at P22; (B) Summary of insertions/deletions in the kidneys of +/+ control and -/- samples with and without DMBA exposure. The final column represents numbers of unique indels that occurred at low frequency (f ≤ 0.5) in kidney DNAs of individual +/+ and -/- mice. Indels that were common to all the mice or common to the +/+ or -/- DNAs were subtracted.

