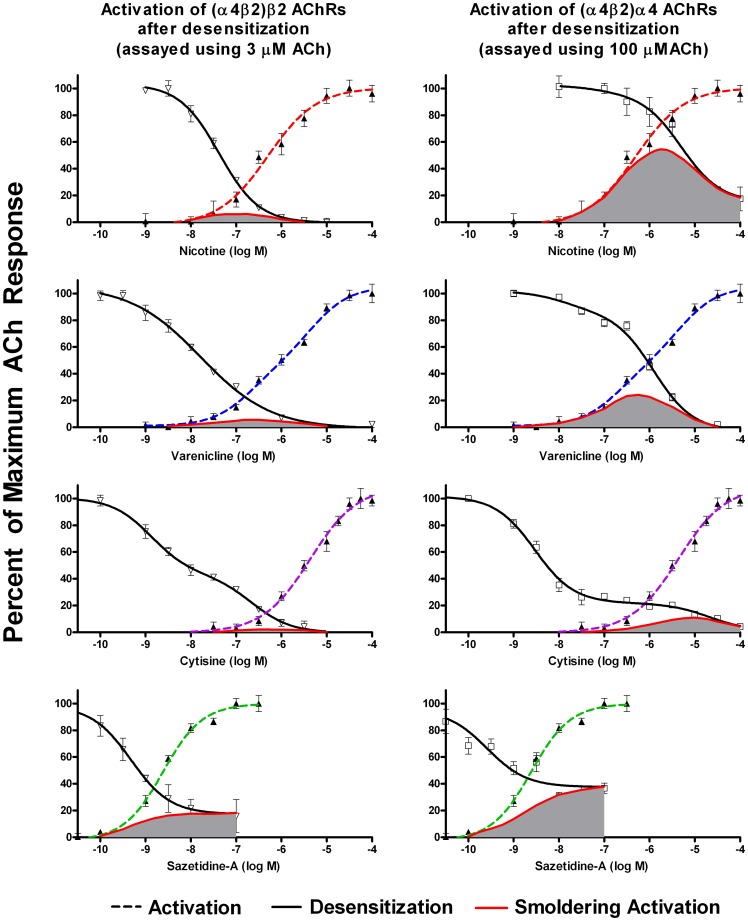
Figure 3. Activation and Desensitization of α4β2 AChRs by Various Agonists.
Responses were measured using the FLEXStation with an indicator sensitive to changes in membrane potential. Results are expressed as a percentage of maximum fluorescence. Activity remaining after 16 hours desensitization by the indicated concentrations of agonist was assayed using 3 µM ACh (to assay function of the more sensitive stoichiometry (α4β2)2β2), and 100 µM ACh (to assay function of both stoichiometries). Each data point is the average of the peak fluorescence of 4–8 dose-response curves. The responses to acute application of agonists are the same as shown in Figure 2. The extent of smoldering activation (shaded area) was calculated by multiplying the extent of acute activation by the extent of sustained desensitization at each concentration. For nicotine, the area of overlap for the more sensitive (α4β2)2β2 stoichiometry was centered at 0.13 µM, which is a concentration typically found in smokers. Likewise for varenicline, the area of overlap for the more sensitive (α4β2)2β2 stoichiometry was centered at 0.16 µM, which corresponds to peak concentrations achieved in humans. Sazetidine-A was highly potent at activating as well as desensitizing α4β2 AChRs. The area of overlap for (α4β2)2β2 AChRs was centered at 1.5 nM. When 100 µM ACh was used for desensitization, there was a plateau on the dose response curve beginning at around 10 nM.

