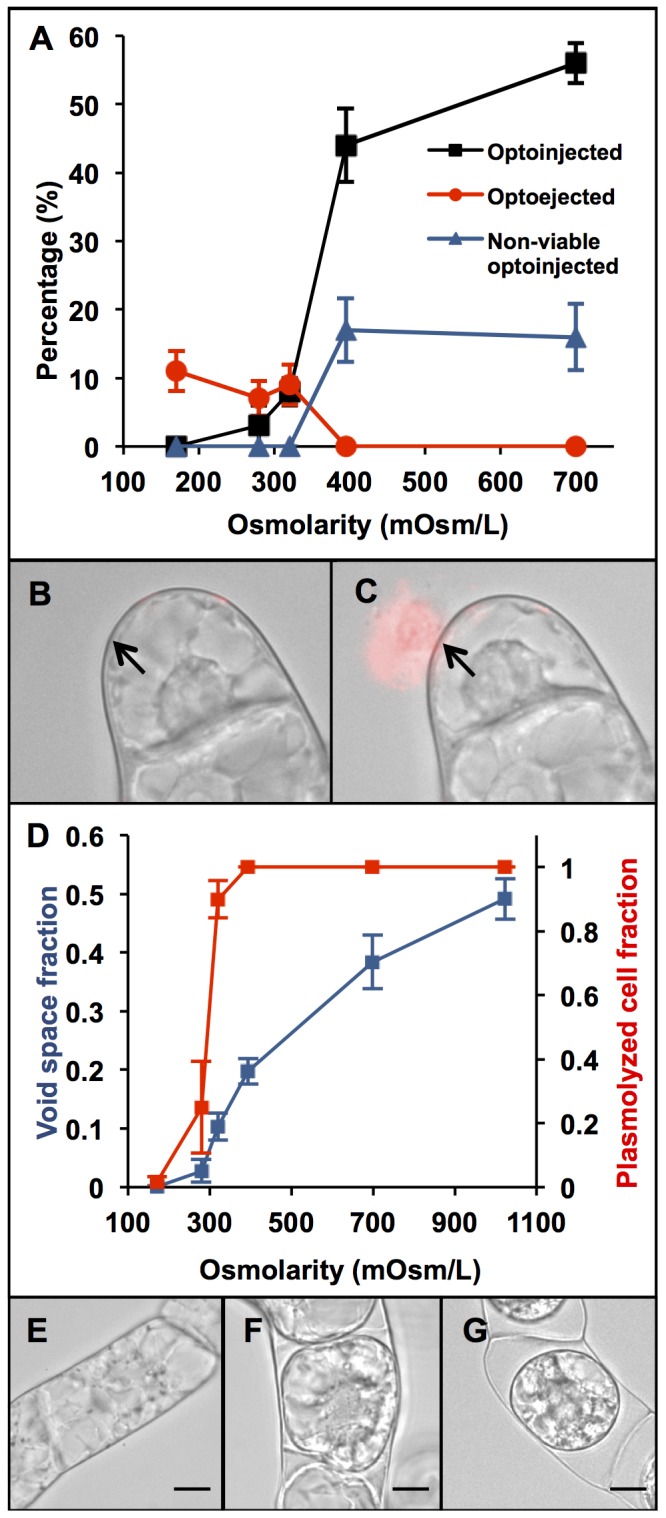
Figure 4. Optoinjection efficiency differs depending upon the osmolarity of the surrounding medium.

From looking at A, as we increase the osmolarity, the efficiency of optoinjection (black squares) increases from zero up to 50% as the surrounding medium changes from hypertonic to hypotonic. Conversely, the optoejection efficiency (red circles) falls from around 10% to 0% above 320±2 mOsm/L. As the molarity of the solution increases, the likelihood of cell death (represented by blue triangles) is increased. At 320±2 mOsm/L the optoinjection and ejection efficiency are approximately equal. Each data point was performed in triplicate with 20 cells; error bars represent S.E.M. B and C show brightfield and fluorescence overlays of a cell prior to (B) and 2 minutes after (C) laser irradiation in standard culture medium in the presence of PI. Photoporation induces a flux of cytosol from the cell into the extracellular medium. The cytosol ejected from the cell becomes stained with PI and a bright fluorescence is seen exterior to the cell. Large changes in cell morphology occur and cell death is induced. D shows the osmotic effect on plasmolysis of BY-2 cells. Both the void space (blue) and fraction of plasmolyzed cells (red) increases with the osmolarity of the surrounding medium but the red line shows a much steeper incline around the point of incipient plasmolysis (50%). Error bars denote the S.E.M. for n = 3 experiments with 20 cells counted in each. E-G show example cells in standard culure medium (171±2 mOsm/L), very weakly hypotonic (320±2 mOsm/L) and strongly hypotonic (699±4 mOsm/L) solutions respectively, with the resulting plasmolysis occurring slightly in F but seen very strongly in G as the membrane pulls away from the cell wall in the highly osmotic solution. Scale bars denote 10 µm.
