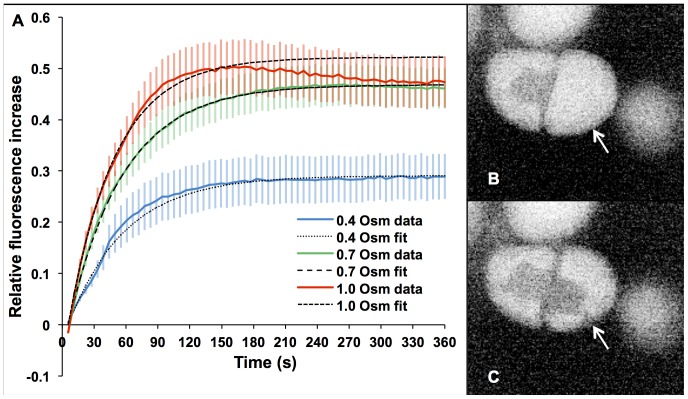
Figure 5. Uptake of calcein during photoporation in hypertonic medium.
Solid lines in A show the mean increase in intracellular fluorescence relative to background for n = 20 cells with error bars representing 0.5 S.E.M. for clarity. Each curve shows a sharp increase in fluorescence in the first few minutes after photoporation, which plateaus after around 3 minutes. The higher molarity solutions show a quicker increase in calcein uptake and reach a higher level of maximum fluorescence than the lower molarity solutions. Dashed lines denote fitted saturation curves. B and C show a cell (arrowed), in negative contrast for clarity, before and 60 seconds after photoporation in 0.4 Osm/L medium containing calcein. The nucleus, indistinguishable from the rest of the unporated cell in B, becomes filled with calcein along with a cytosolic strand (just visible at arrow tip) but none enters the large vacuole surrounding it.

