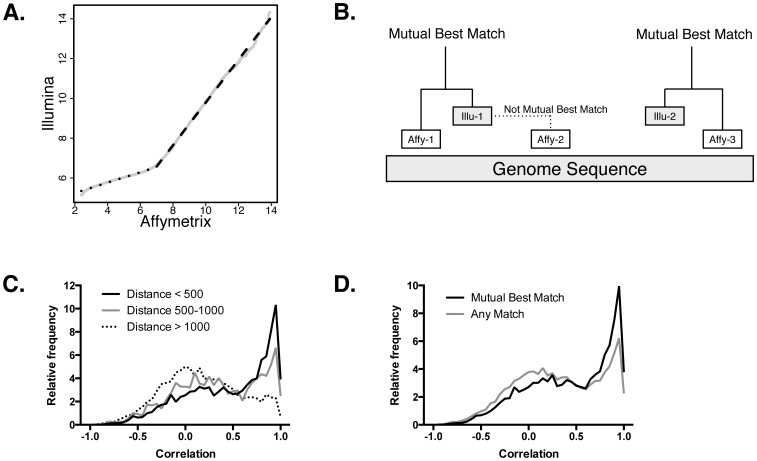
Figure 1. Correspondence of gene expression between the Affymetrix and Illumina platforms.
A. The signal values on Affymetrix and Illumina microarrays are bilinear. The x-axis shows the distribution of gene expression values of a melanoma tumor on an Affymetrix microarray. The y-axis shows the distribution of the expression of the same sample on an Illumina microarray. Both high and low expression values are linearly related, but with different slopes. B. Probes from Affymetrix and Illumina microarrays are mapped onto their target in the human genome. The distance to the nearest probe of the other platform are calculated. If a pair of probes from the opposing platform are both closest to each other, they are considered mutual best matches, for example, Affy-1 and Illu-1. However, Illu-1 and Affy-2 are not mutual best matches. While Illu-1 is the best match for Affy-2, the converse is not true in this case. C. This histogram shows the correlation of the expression profiles of probes that are different distances apart. There is an enrichment of correlations close to 1.0 in probes that are closer. Probes that are over 1000 base pairs apart show no enrichment of highly correlated probes. D. This shows the differences in the correlations between pairs of probes that are mutual best matches and ones that are not. Probes that are mutual best matches have higher correlations than otherwise.

