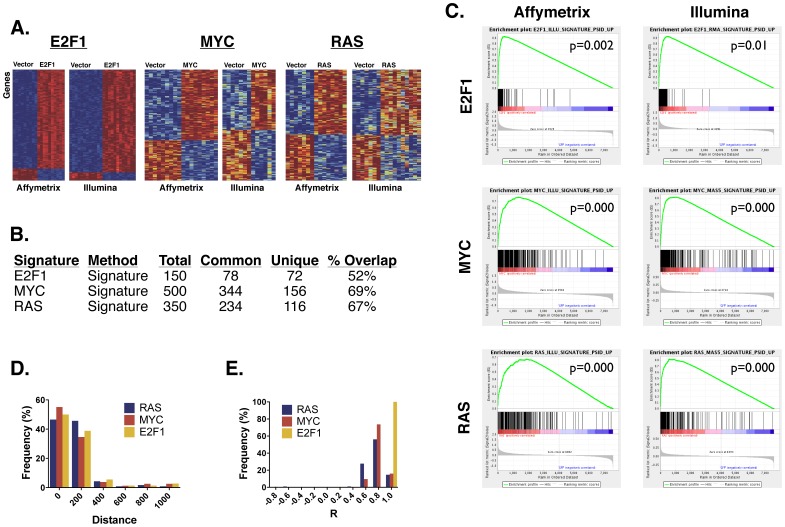
Figure 2. Comparison of gene expression signatures across the Affymetrix and Illumina platforms.
A. These heatmaps show the gene expression signatures of the E2F1, MYC, and RAS pathways collected on Affymetrix and Illumina. Each row in the heatmap represents a gene in a signature. Each signature contains a different set of genes, so the genes are not aligned across all heatmaps. Each column represents a sample expressing either a vector control or pathway gene. The color indicates the expression level of the gene, where red indicates high expression, and blue indicates low expression. B. This table shows the number of genes in each signature. Total indicates the total number of genes in the signature, Common is the number of genes shared between the Affymetrix and Illumina platforms, Unique is the number of genes unique to each platform, and % Overlap is the percent of genes shared. C. These are GSEA Enrichment plots that show the similarity between the genes in the Affymetrix and Illumina signatures. Each of the three rows contains a different signature. The Affymetrix signatures are in the left column, and the Illumina ones are on the right. In the top left plot, the Affymetrix gene expression file are sorted from left to right according to the GSEA signal-to-noise metric, where the ones most highly associated with E2F1 are on the left, and the ones most highly associated with the vector control are on the right. The vertical black bars in the middle of the plot show the position of the genes associated with E2F1 in the Illumina signature. Most of the black bars are clustered on the left, indicating a high concordance of the genes associated with E2F1 across the two platforms. The other plots can be interpreted similarly. D. This histogram shows the relative percent frequency of the genomic distance between the Affymetrix and Illumina probes that are shared in the RAS, MYC, and E2F1 signatures. E. This histogram shows the relative percent frequency of the Pearson correlation of the expression values between the probes in the Affymetrix and Illumina signatures.

