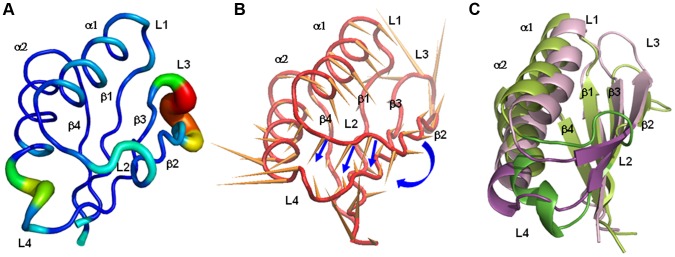
Figure 2. Mobility and conformational change of loop-containing regions.

A) Sausage representation of the wt-PAH initial structure, in which the thickness of the sausage is proportional to the root mean square fluctuation of Cα atoms from their average positions. Average positions are calculated after least-squares fit superimposition of the trajectory structures onto the starting structure used as reference. B) Porcupine representation of the first PC (accounting for 78% of the overall fluctuation of Cα atoms) extracted from the simulation of the wt-hPAH. The orange cones, attached to the average positions of each Cα atom, point in the direction of motion described by PC1. Blue arrows highlight the motion corresponding to the transition of L2 to β-strand. C) Initial (light green) and final (light pink) wt-hPAH structures with the L2 and L4 regions drawn in green and magenta.
