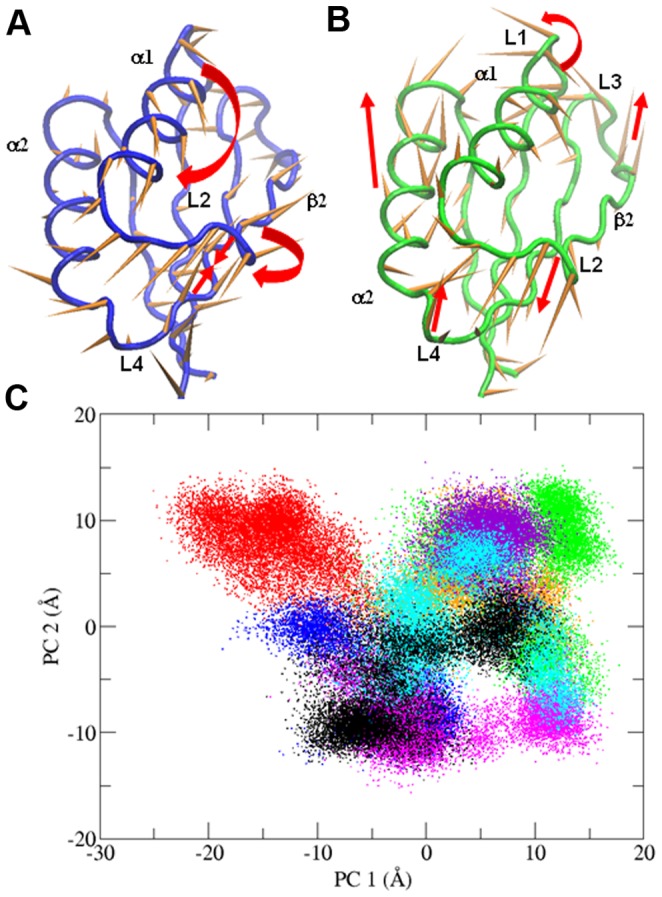
Figure 4. Combined essential dynamics analysis.

A) Porcupine plots illustrating the conformational changes represented by the first and B) the second PCs from the combined ED analysis. Each Cα atom has a cone pointing in the direction of conformational change described by each PC. C) Projections of each trajectory along PC1 and PC2 from the combined ED. Color code: wt-hPAH in black, wt-rPAH in red, G46S in orange, F39C in blue, F39L in green, I65T in violet, I65S in magenta, I65V in cyan.
