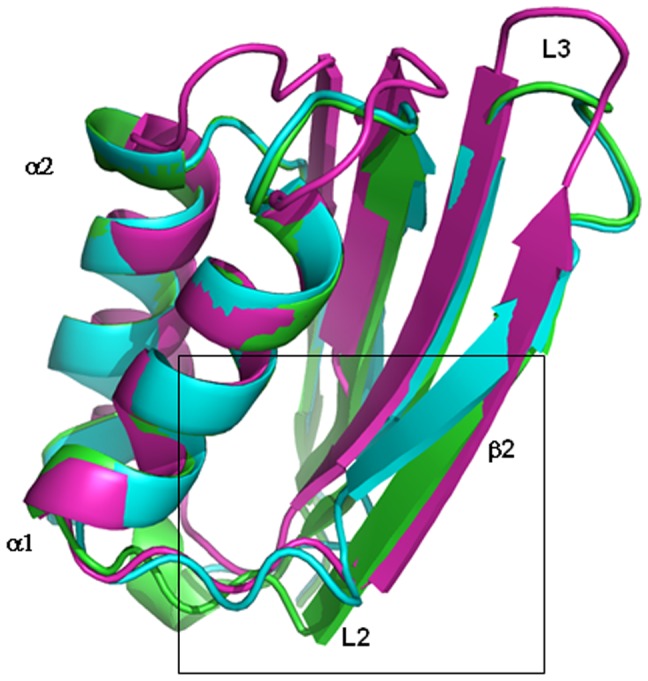
Figure 5. Superimposition of the ACT domains.

Superimposition of the ACT domains of D-3-phosphoglycerate dehydrogenase from Escherichia coli (magenta), crystallographic wt-rPAH (cyan) and in silico model of wt-rPAH (green). The L2 region discussed in the article is boxed.
