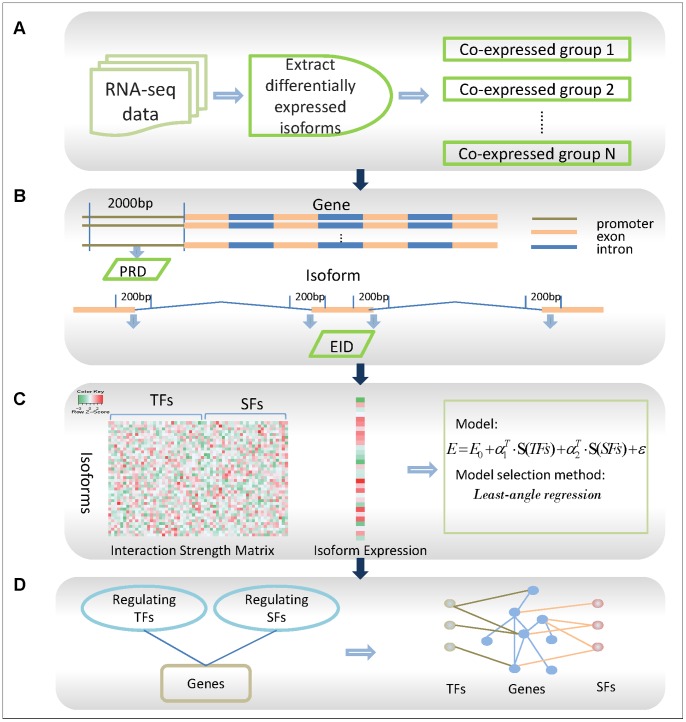
Figure 1. Flowchart of proposed method for constructing regulatory networks.
Flowchart of proposed method for constructing regulatory networks: (A). Process raw RNA-seq data, find out deferentially expressed isoforms using Tophat and Cufflinks and cluster these isoforms to get gene cluster that may be regulated by same TFs and SFs. (B). Construct two dataset, promote region data (PRD) and exon-intron data (EID), for mining the interaction strength of the TF-isoform interactions and SF-isoform interaction. (C). Use interaction strength to predict the expression levels of isoforms in a co-expressed group. (D). Link model-selected TFs and SFs with their target genes.

