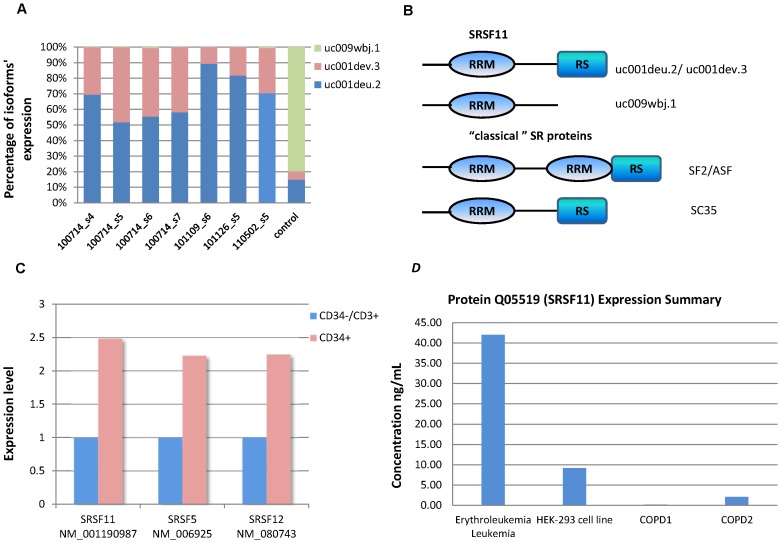
Figure 2. Expression ratio of SRSF11’s three isoforms (A), motifs in SRSF11’s isoforms and classical SR proteins (B), RT-PCR results (C) and protein Expression of SRSF11.
(A). Expression ratio of SRSF11’s three isoforms in seven disease sample and control: uc009wbj.1 (light green), uc001deu.2 (light blue) and uc001.dev.3 (light red). They have almost the same total expression levels but very different ratios in MDS (four ) and control (average of five controls), which means the splicing patterns of SRSF11 are switched. (B). This figure demonstrates motifs in SRSF11’s isoforms and classical SR proteins. Different motifs have different bio-function. (C). Three isoforms that are over-expressed in our disease samples are picked up for RT-PCR validation. They are isoforms of three splicing factor, one isoform (uc001deu.2, refseq ID: NM_001190987) of SRSF11, one isoform (uc001xlp.3, refseq ID: NM_006925) of SRSF5 and one isoform (uc003jun.2, refseq ID:NM_080743) of SRSF12. Validation demonstrated that their expression levels in MDS disease are higher than in control. (D). Isofrom uc001deu.2 is translated into protein Q05519 and Q05519 is highly expressed in blood disease according to the Model Organism Protein Expression Database (MOPED); COPD: Chronic obstructive pulmonary disease.

