
Figure 3. Investigating markers of apoptosis.
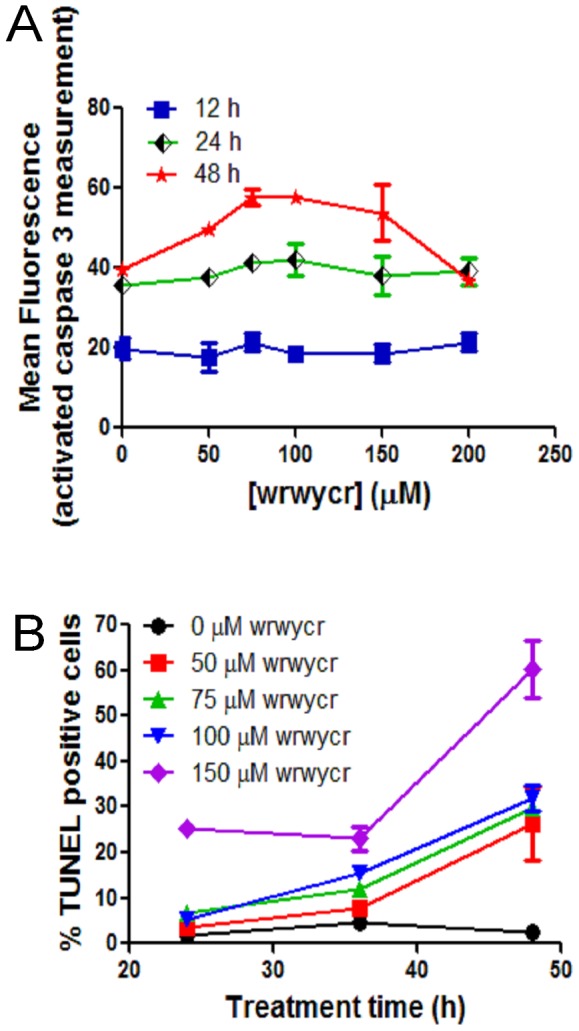
A: PC3 cells were treated with 50, 75, 100, 150, 200 µM of wrwycr for 12, 24 or 48 h and examined for caspase-3 markers. The reading from spectrophotometer was normalized to the protein concentration of each sample and mean fluorescence in Y-axis was plotted after dividing the fluorescence from each sample by the corresponding protein concentration at OD595. B: PC3 cells were treated as specified with wrwycr for 12, 24 and 48 h, and examined for DNA breaks using the TUNEL assay. A significant increase in TUNEL positive cells was observed with all the different doses of wrwycr treatment after 48 h, as determined by a two-way ANOVA using Bonferroni post-test analysis.