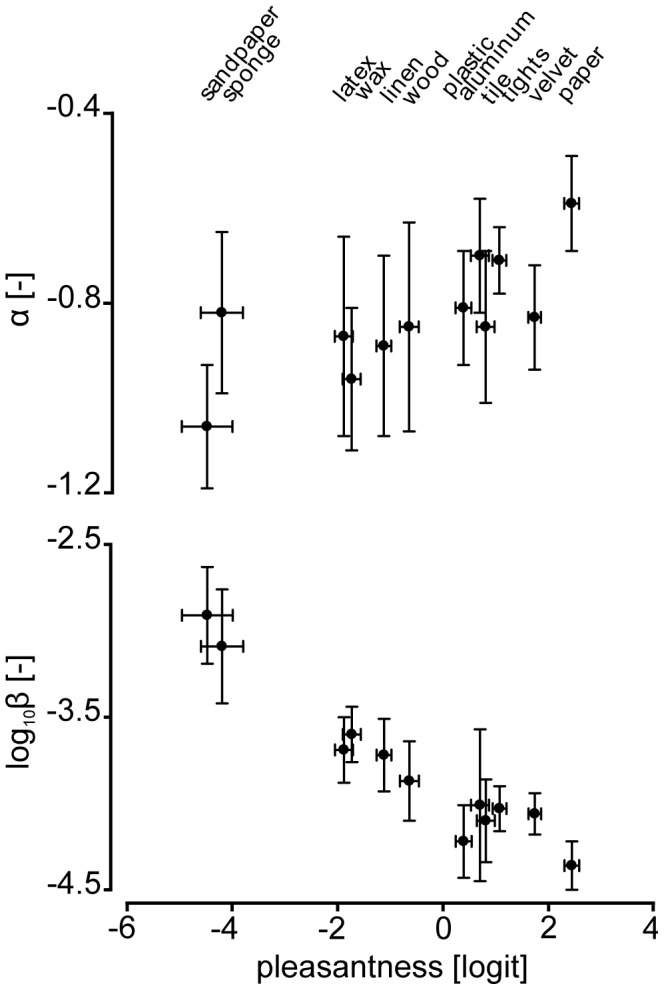
Figure 5. Illustration of correlations between (i) α - pleasantness and (ii) β - pleasantness.

Illustration of the mean±std values of the decay coefficient, α, (top) and the mean±std values of the offset, β, (bottom) variations according to the material pleasantness levels±standard error being explored.
