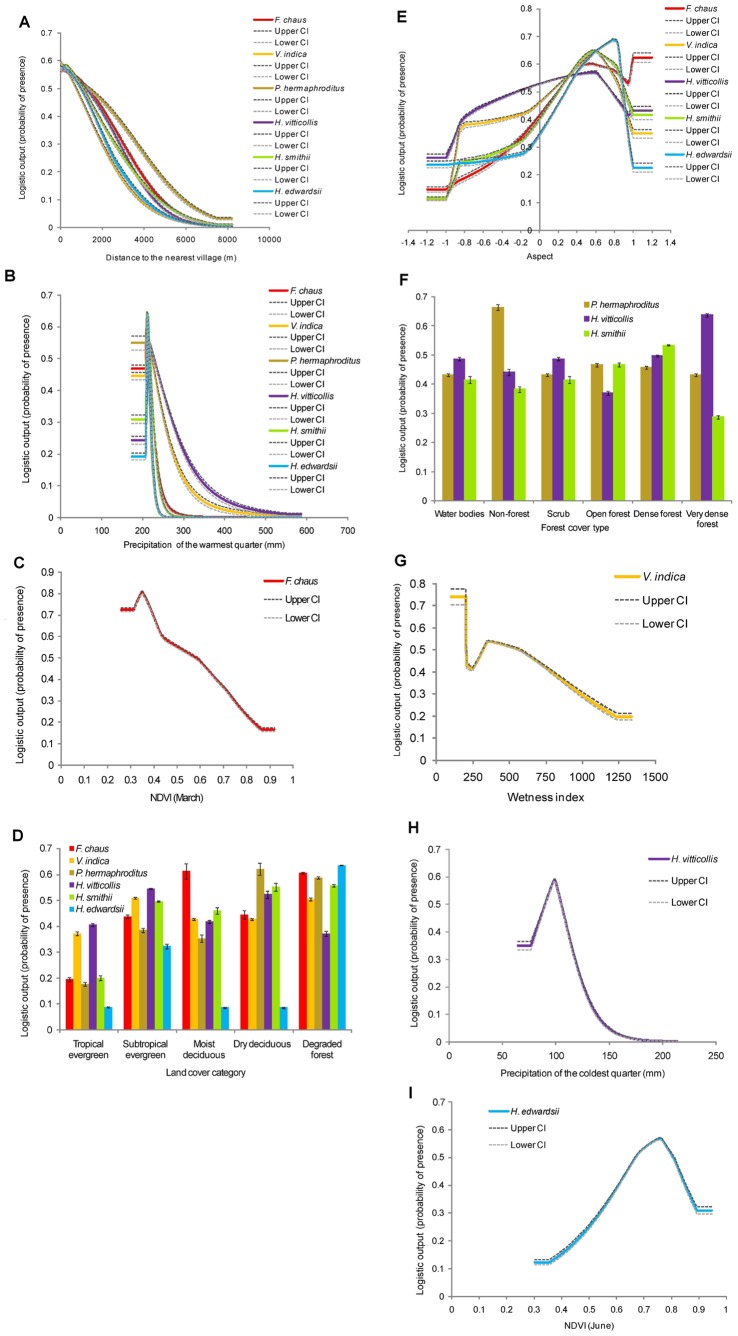
Figure 3. Response curves for the most significant predictors of habitat suitability of small carnivores according to the MaxEnt model.
The response curve is shown in different colours. Each colour represents a different species. The dark grey and light grey dotted lines represent 95% confidence intervals from 40 replicated runs.

