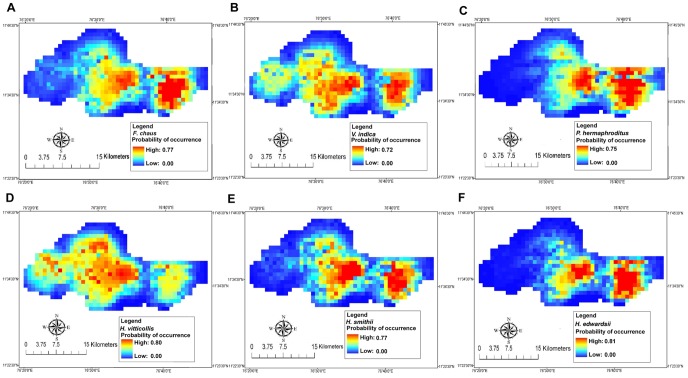
Figure 4. Habitat suitability maps of small carnivores based on MaxEnt models using environmental variables.
Average MaxEnt predictions from 40 runs for each species at the scale of 1×1 km resolution. The predicted probability of presence, with values ranging from 0 to 1, is depicted by different colours. Using the MaxEnt logistic output, red colours indicate a higher “probability of occurrence” (suitability) while the blue colours indicate lower probabilities.

