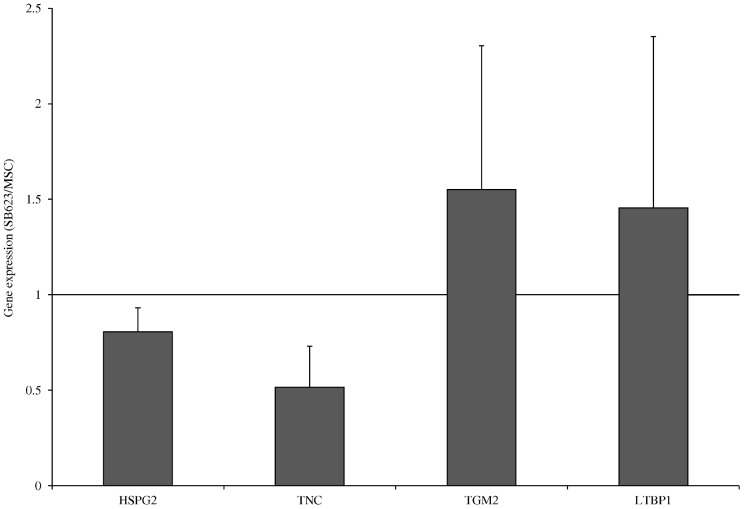
Figure 5. Differences in gene expression levels between SB623 and MSC are consistent with differences detected using SAISD-nLC-MS/MS.
Gene expression levels were quantified using qRT-PCR and normalized to the expression of GAPDH; normalized values for MSC were set to 1 and values for SB623 were expressed relative to MSC. Four proteins were analyzed: perlecan (HSPG2), tenascin-C (TNC), transglutaminase 2 (TGM2), and latent-transforming growth factor beta-binding protein 1 (LTBP1). The qRT-PCR data was taken from 5 different human donor pairs, two of which were the same (donors 3 and 4) as in Figure 2, one SAISD-nLC-MS/MS donor (Table 2) and two unassociated donors. Mean ± SD.

