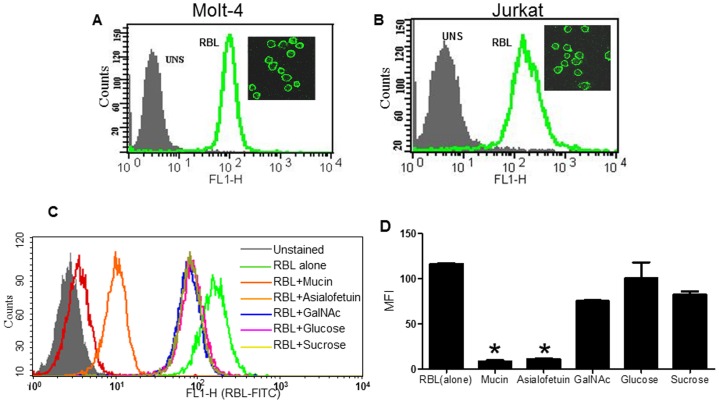
Figure 1. Binding of RBL and inhibition with sugars.
The binding of FITC- labeled RBL to Molt-4 (A) and Jurkat (B) cells was determined by flow cytometry analysis. The histoplots depict the profiles of unstained cells (shadow) and cells stained with FITC-RBL (green). The binding of RBL to cell membrane of Molt-4 (A inset) and Jurkat (B inset) was visualized by confocal laser scanning microscopy. Original magnification 60×. (C) Molt-4 cells were stained with FITC-labeled RBL alone or RBL pre-incubated with different sugars and flow cytometry analysis was performed. X-axis represents fluorescence intensity, Y-axis represents cell number. The overlay shows profiles of the unstained cells (shadow), RBL stained cells (green) and cells stained with RBL +Mucin (red), +asialofetuin (orange), +GalNAc (blue), +glucose (pink), and sucrose +(yellow). (D) The graph represents mean MFI±SE from three independent experiments. *p<0.05 difference in MFI compared to cells stained with RBL alone.

