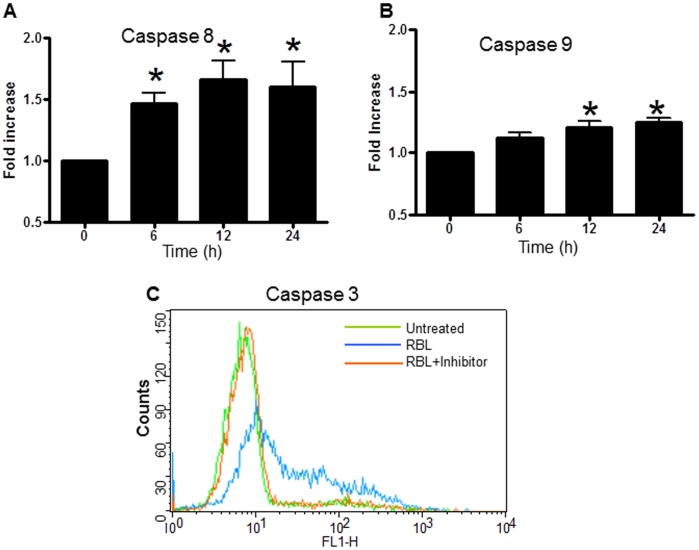
Figure 5. Effect of RBL on activation of caspases.
Molt-4 cells were treated with 5 µg/ml RBL for different time periods and activities of caspase-8 (A) and caspase-9 (B) were assessed by colorimetric assay using specific substrates Ac-IETD-pNa and Ac-LEHD-pNa respectively. The graph depicts fold increase in caspase activity with respect to 0 h controls (activity at 0 h was considered as 1). The data is mean±SE values from three independent experiments. *p value <0.05 in comparison with 0 h controls. (C) Molt-4 cells were treated with RBL (5 µg/ml) for 12 h and activity of caspase-3 was determined by flow cytometry analysis using FITC tagged caspase–3 inhibitor (blue line). Cells pretreated with caspase-3 inhibitor ZVAD-FMK (red line) and untreated cells (green line) were used as controls. The histoplot is representative of three similar experiments.

