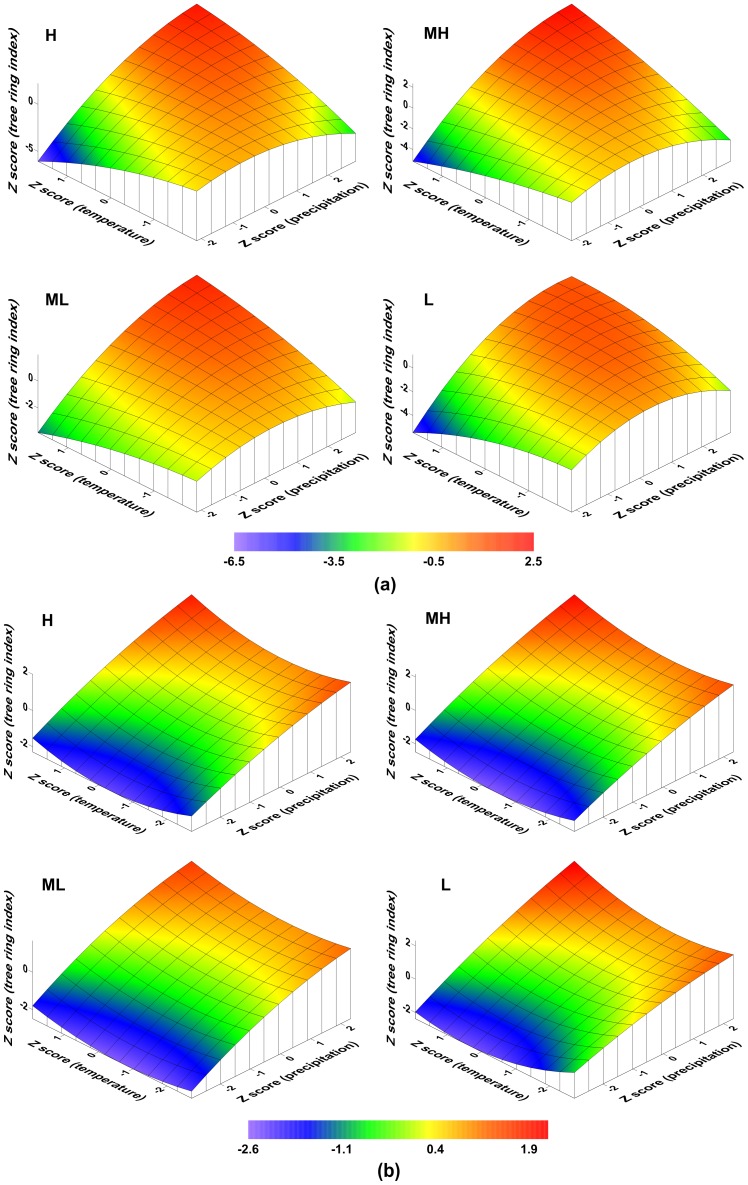
Figure 10. Response surfaces for standardized tree ring index (a) and first-order differential series of standardized tree ring index (b) for four different elevations: H, MH, ML, L.
The height of each surface represents the magnitude of growth response to a given combination of annual (previous July to current June) precipitation and winter (previous September to current March) temperature. All data (including precipitation, temperature, and standardized tree ring index) are Z score transformed in order to eliminate the impact of different dimensional units.

