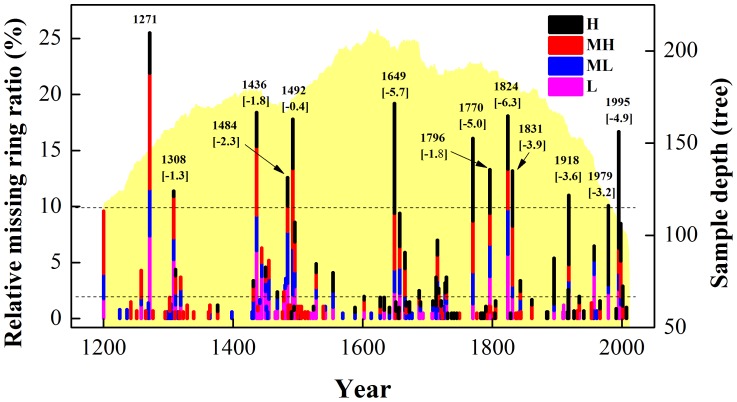
Figure 13. Comparison of relative missing ring ratios at four altitude belts and for the whole hillside in MNT, Delingha, northeast Tibetan Plateau during 1200-2011.
Sample depth homogenization was applied to reduce sample-depth-related disturbance prior to computing the relative missing ring ratio. Bar heights indicate missing ring ratios for all samples each year, as visualized by different colored bars (the length of each bar corresponds to the relative missing ring ratio at each elevation). The light yellow shadow is the sample depth. The two dotted lines correspond to the relative missing ring ratios of 10% and 2%, respectively. The values on each bar are the corresponding year and PDSI value (in square brackets, Cook et al., 2010) for those years when the relative missing ring ratio exceeds 10%.

