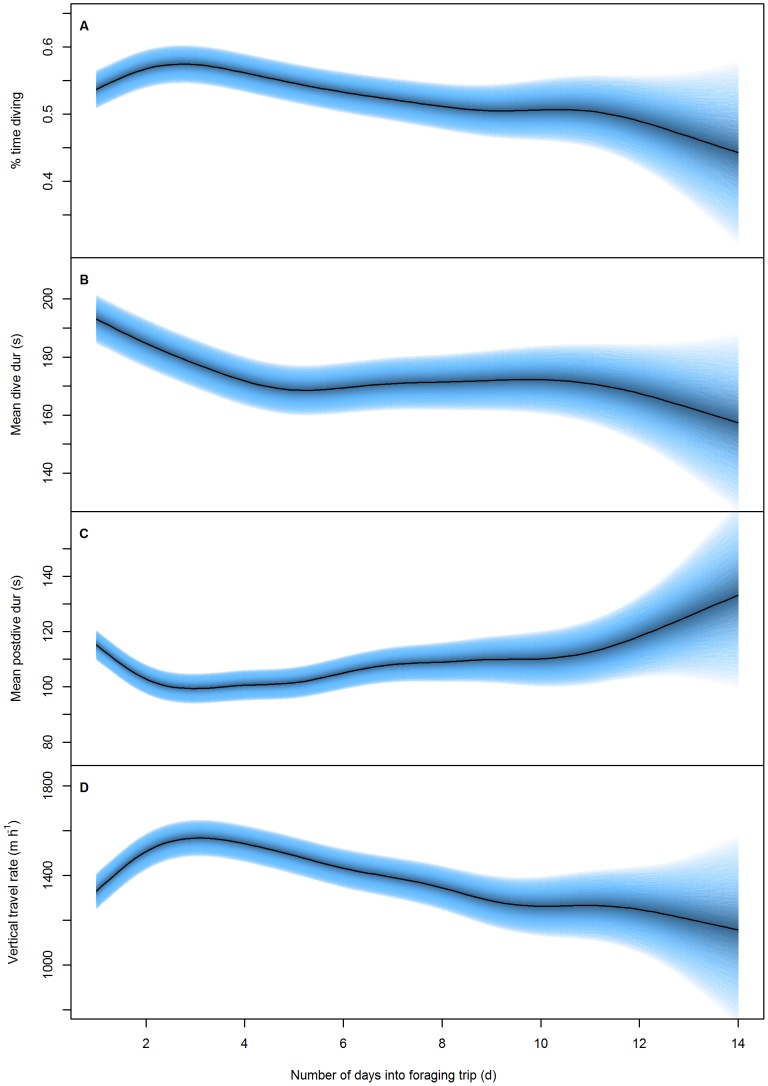
Figure 2. Foraging effort response to number of days into foraging trip.
The predicted response of A) proportion of time diving (%), B) mean dive duration (s), C) mean post-dive duration (s) and D) vertical distance covered (m·h−1) in female Australian fur seals to the number of days into a foraging trip. Blue bands represent the 95% confidence intervals around the predicted response. (see Table 1 for statistical results).

