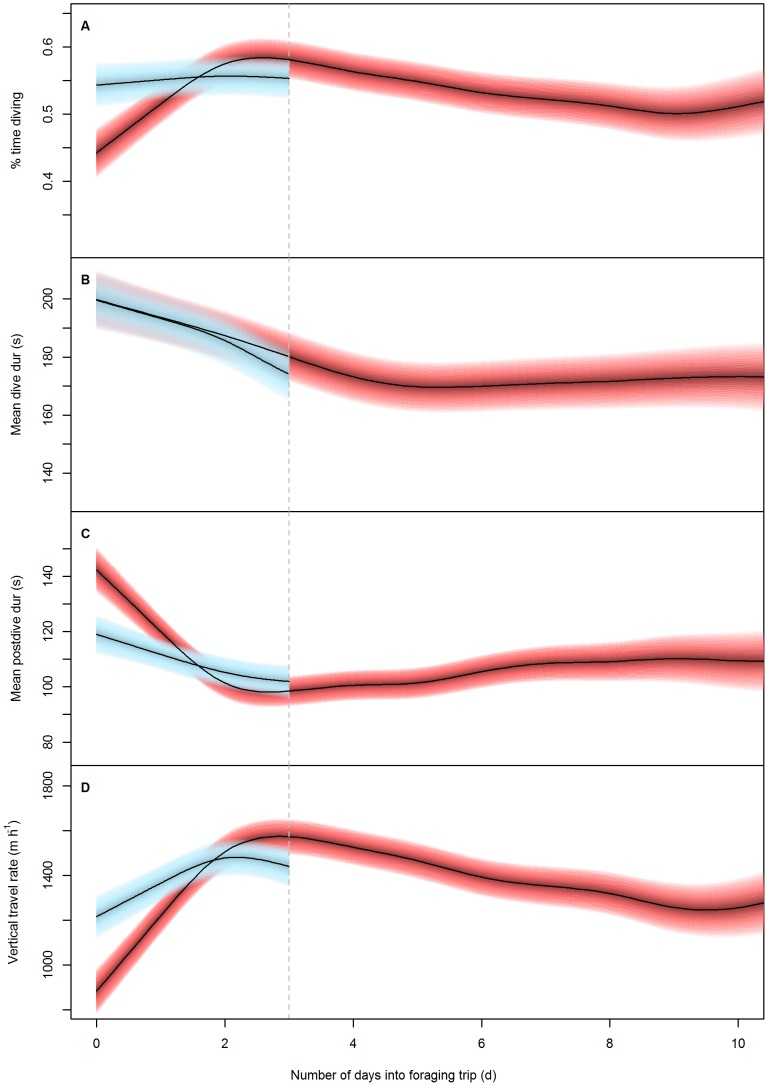
Figure 3. Foraging effort response to number of days into short and long foraging trips.
The predicted response of A) proportion of time diving (%), B) mean dive duration (s), C) mean post-dive duration (s) and D) vertical distance covered (m·h−1) during short (light blue) and long (red) foraging trips in female Australian fur seals to the number of days into a foraging trip. Blue bands represent the 95% confidence intervals around the predicted response. (see Table 2 for statistical results). Note: limits of x-axes have been restricted to 10 days to improve distinction between the responses of short and long foraging trips (i.e. the first three days of long trips). For more information on the predicted responses of long foraging trips exceeding 10 day refer to figure 2.

