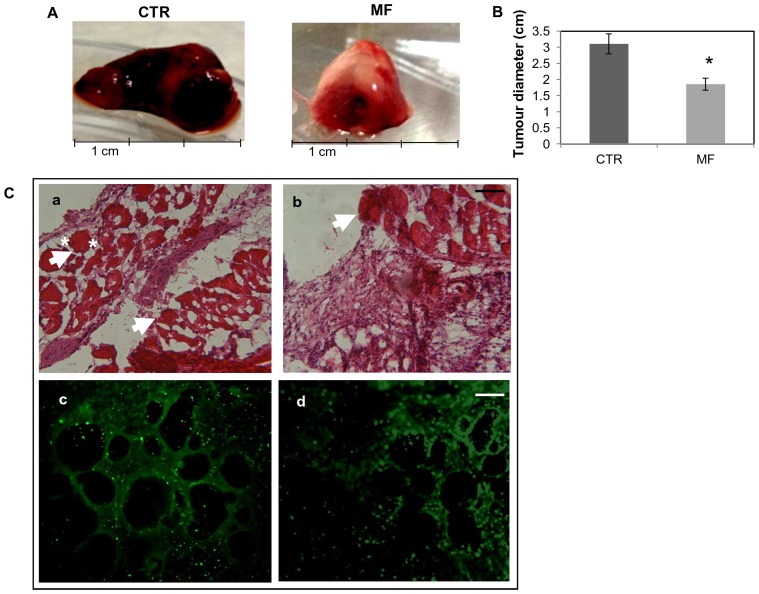
Figure 4. Inhibition of tumour size in mice inoculated with MS-1.
A) MF (2 mT, 50 Hz) exposed cells (right) in comparison with unexposed cells (left). B) The size of the tumour was reduced in mice inoculated with MF treated MS-1 cells compared to control mice (inoculated with control cells). N = 5 mice per group, * P<0.05. C) Histology of tissue samples from a mouse inoculated with control cells showed a vascular tumour with large blood-filled lumens (a). The density and size of vessels is reduced in samples from mouse bearing MF-treated cells (b). White arrows indicate some blood filled structures. White asterisks indicate a blood filled diameter. Bar = 0.1 mm.VEGFR2 immunofluorescence micrographs of tissue sections from mice inoculated with control (c) and MF treated cells (d) Bar = 0.2 mm.

