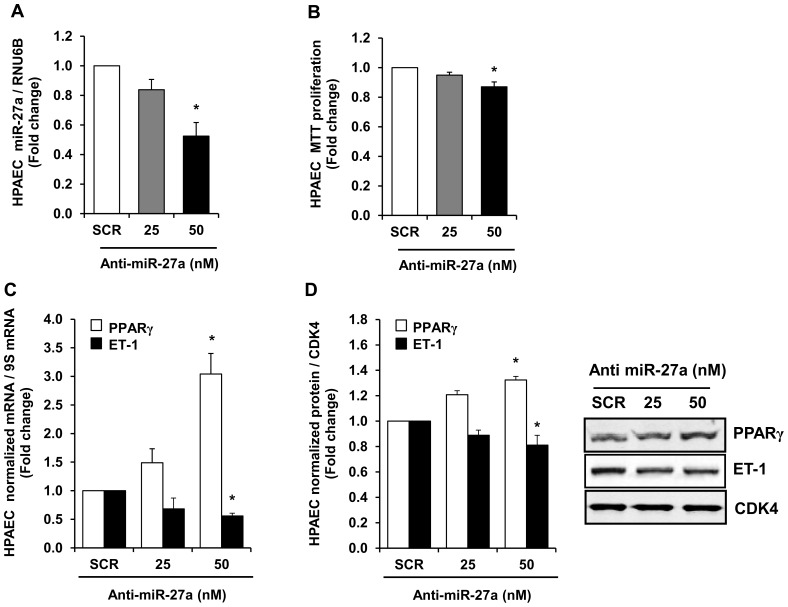
Figure 4. Anti-miR-27a reduced HPAEC miR-27a levels, HPAEC proliferation, and ET-1 levels and increased PPARγ expression.
HPAECs were treated with either scrambled (SCR) or 25–50 nM anti-miR-27a for 72 hours. HPAEC were then collected, and RNA was isolated. qRT-PCR was performed for miR-27a, PPARγ, and ET-1 levels. Western blotting was employed to detect PPARγ and ET-1 protein levels. HPAEC proliferation was determined using MTT assays. Each bar represents the mean ± SE miR-27a/RNU6B (A), proliferation (B), PPARγ or ET-1 mRNA relative to ribosomal S9 (9S RNA) (C), or PPARγ or ET-1 protein relative to CDK4 protein (D) expressed as fold-change vs. SCR. *p<0.05 vs. scrambled (SCR) miRNA, n = 3–5.

